

In this article (13 sections)
- What is RSI in forex?
- How is the RSI indicator calculated?
- How to use RSI: what do 70, 30 and 50 mean?
- RSI in trending markets vs ranging markets
- How traders use the RSI centreline
- RSI divergence: what it can and cannot tell you
- What is an RSI failure swing?
- RSI settings: what changes when the period changes?
- A practical RSI reading framework
- Worked forex example: bearish divergence inside an uptrend
- Common RSI mistakes
- Frequently asked questions
- Key takeaway
The Relative Strength Index (RSI) is a momentum oscillator that compares recent gains with recent losses and plots the result from 0 to 100. Traders often watch 70 as an overbought reference, 30 as an oversold reference and 50 as a momentum centreline. These levels are context tools, not automatic reversal signals: RSI can stay elevated or depressed while a strong trend continues.
What is RSI in forex?
RSI is a bounded momentum oscillator developed by J. Welles Wilder Jr. It converts the balance between recent positive and negative price changes into a value between 0 and 100. The conventional 14-period setting, 70/30 reference levels and 50 midpoint are widely used starting points, but their meaning depends on market structure, timeframe and regime.
In practice, an RSI reading describes recent momentum rather than future price certainty. A value above 70 can accompany an established uptrend, while a value below 30 can persist during a strong decline. This is why learning how to use the RSI indicator starts with context rather than with a mechanical “buy below 30, sell above 70” rule.
How is the RSI indicator calculated?
RSI formula: RSI = 100 – 100 / (1 + RS), where RS = average gain / average loss over the selected lookback.
The common baseline uses 14 bars. TradingView documents Wilder-style smoothing through its RMA calculation, and MetaTrader 5 describes the same core ratio of average positive to average negative price changes. The initial averages are established over the lookback, then the ongoing values are smoothed rather than recalculated as a simple rolling arithmetic mean on every bar.
- Calculate positive and negative price changes over the chosen lookback.
- Derive the smoothed average gain and average loss.
- Divide average gain by average loss to obtain RS.
- Convert RS to the 0-100 RSI scale using the formula above.
Default is not “best”: Fourteen periods is the mainstream platform default and the baseline used in this article. Shorter or longer settings change sensitivity and should be evaluated for the instrument, timeframe and purpose rather than assumed to improve performance.
How to use RSI: what do 70, 30 and 50 mean?
| RSI area | Common interpretation | What it does NOT mean | Context check |
|---|---|---|---|
| 70+ | Conventionally overbought; recent upside momentum is strong | Price must fall immediately | Is price trending or testing a range boundary? |
| Around 50 | Momentum balance / centreline | The market has no trend | Is RSI holding one side of 50 with price structure? |
| 30- | Conventionally oversold; recent downside momentum is strong | Price must rebound immediately | Is the decline persistent or is price at a meaningful range/support area? |
The most important wording is “reference level”. Overbought and oversold describe momentum conditions, not guaranteed turning points. Some traders adapt thresholds such as 80/20 in persistent trends, but customised levels should be documented and tested rather than presented as universal settings.
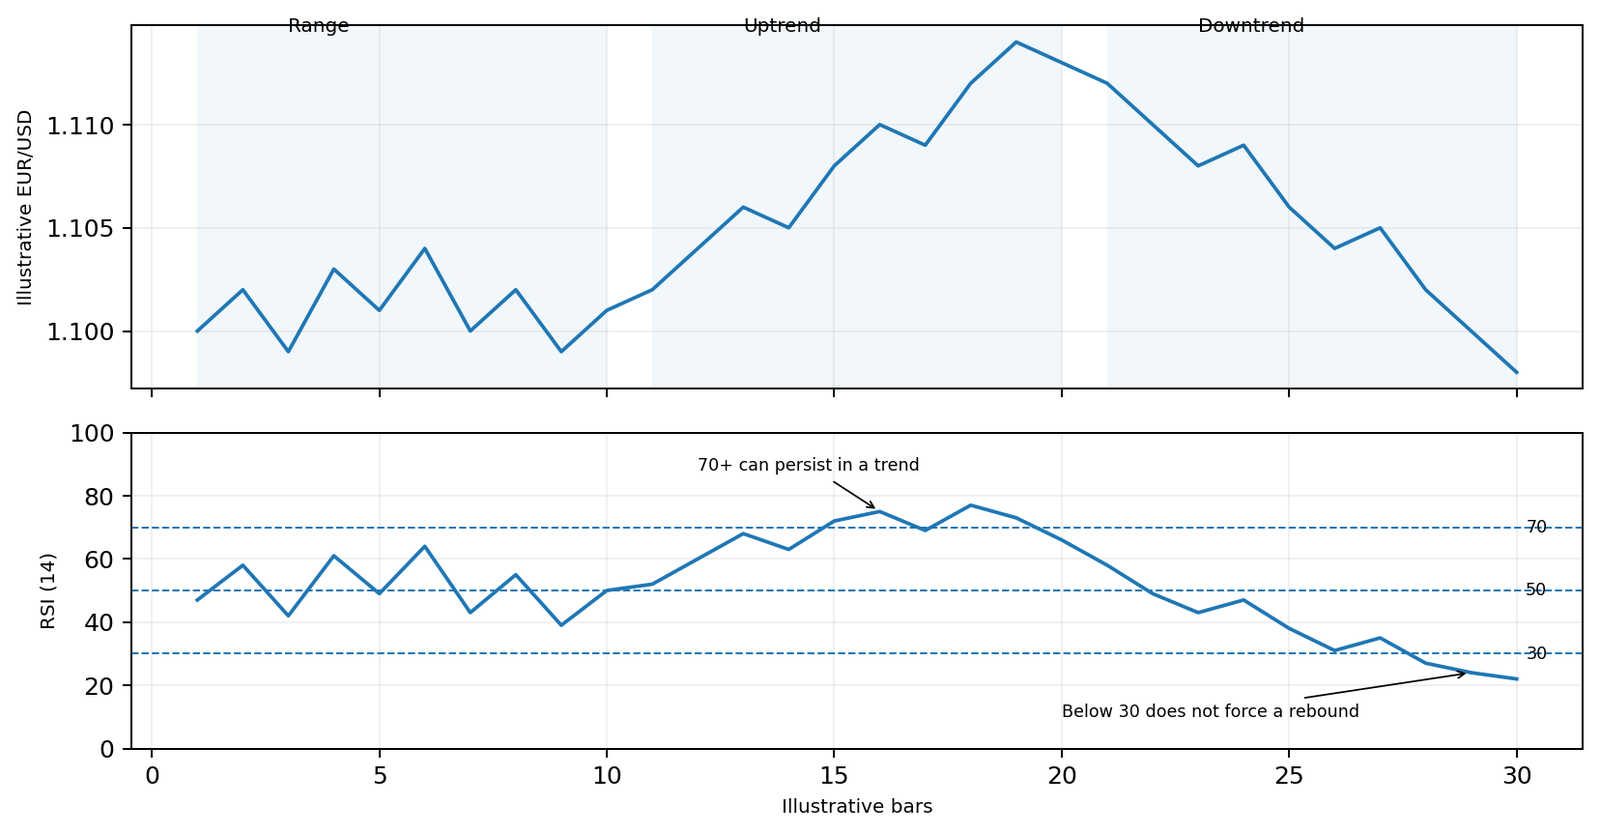
RSI in trending markets vs ranging markets
| Market regime | Typical RSI behaviour | Useful context | Main failure mode |
|---|---|---|---|
| Range | Oscillator may rotate repeatedly between upper and lower zones | Read extremes alongside range boundaries and price rejection | Treating every threshold touch as a complete signal |
| Uptrend | RSI may hold above 50 and revisit 70+ repeatedly | Momentum persistence and pullback behaviour | Selling every overbought reading against the trend |
| Downtrend | RSI may hold below 50 and revisit 30- repeatedly | Momentum weakness and failed rebounds | Buying every oversold reading against the trend |
| Transition | RSI may whipsaw around 50 while price structure changes | Wait for clearer price confirmation | Over-reading centreline crosses in chop |
The same RSI number can mean different things in different regimes. A reading of 75 near a range boundary may be interpreted differently from a reading of 75 in a strong trend that continues to print higher highs and higher lows.
How traders use the RSI centreline
The 50 level is the midpoint of the RSI scale. Sustained readings above 50 indicate that recent gains dominate recent losses in the oscillator calculation, while sustained readings below 50 indicate the opposite. Traders often use this as momentum context alongside price structure rather than as a standalone crossing system.
In clean trends, pullbacks that hold on the same side of 50 can support the existing directional interpretation. In choppy conditions, however, RSI can cross 50 repeatedly, so centreline behaviour should be read together with swing structure, support/resistance and the chosen timeframe.
RSI divergence: what it can and cannot tell you
RSI divergence compares corresponding price swings with RSI swings. Regular bullish divergence occurs when price makes a lower low while RSI makes a higher low. Regular bearish divergence occurs when price makes a higher high while RSI makes a lower high.
| Type | Price structure | RSI structure | Interpretation | Main limitation |
|---|---|---|---|---|
| Bullish divergence | Lower low | Higher low | Downside momentum may be weakening | Price can continue lower before or after divergence |
| Bearish divergence | Higher high | Lower high | Upside momentum may be weakening | Price can continue higher while divergence persists |
Divergence is an observation, not timing confirmation. The article therefore keeps the full regular-vs-hidden divergence taxonomy separate and focuses here on how RSI disagreement can add context. Price-based evidence is still needed before treating the observation as actionable.
What is an RSI failure swing?
A failure swing is an RSI-only sequence. Unlike divergence, it does not depend on comparing price highs or lows with oscillator highs or lows.
Bullish failure swing
- RSI falls below 30.
- RSI rebounds back above 30.
- RSI pulls back but stays above 30.
- RSI then breaks above its prior RSI swing high.
Bearish failure swing
- RSI rises above 70.
- RSI falls back below 70.
- RSI rebounds but remains below 70.
- RSI then breaks below its prior RSI swing low.
A failure swing can be treated as additional momentum evidence, but it still does not guarantee that price will reverse or that an entry will be profitable.
RSI settings: what changes when the period changes?
| Lookback | Responsiveness | Noise / lag trade-off | Use note |
|---|---|---|---|
| Shorter than 14 | Faster | More threshold crossings and more sensitivity to short-term noise | Useful only if the faster behaviour matches the tested method |
| 14 periods | Baseline | Balanced mainstream default, not an optimum | Useful common reference for education and comparison |
| Longer than 14 | Slower | Smoother but can react later to genuine momentum changes | Represents a broader observation window |
Timeframe matters as much as the number. Fourteen five-minute bars cover a very different span from fourteen daily bars. Any alternative length, source or threshold should be documented consistently in charts, examples and backtests.
A practical RSI reading framework
- Choose the analysis timeframe and classify price as trending, ranging or transitioning.
- Read RSI relative to the 50 centreline before focusing on the 70/30 zones.
- Ask whether the oscillator is confirming momentum, diverging from price, or simply remaining extended during a trend.
- Look for price-based confirmation around a meaningful swing or support/resistance area before acting.
- Define invalidation, position size and realistic spread/slippage assumptions before any trade; an RSI reading does not cap loss or guarantee execution.
Risk-aware use: RSI can organise momentum information, but it does not remove false signals, whipsaw risk or execution uncertainty. Treat it as one analytical input within a defined price and risk framework.
Worked forex example: bearish divergence inside an uptrend
Consider an illustrative GBP/USD 1-hour chart using 14-period RSI. Price has been making higher highs and higher lows, and RSI has spent most of the latest advance above 50.
| Observation | Illustrative value / condition |
|---|---|
| Price structure | Higher high -> higher low -> new higher high |
| RSI at first high | 72 |
| RSI pullback | 54 |
| RSI at new price high | 66 |
| Reference levels | 70 / 50 / 30 |
The new price high is accompanied by a lower RSI high (66 versus 72), creating a regular bearish divergence observation. However, RSI remains above 50 and price has not yet broken the prior higher low. The divergence therefore indicates weaker momentum relative to the earlier upswing, not a confirmed bearish reversal.
A cautious interpretation is to note the divergence and then wait for price-based evidence, such as a break of the relevant higher low or a failed attempt to continue higher. If price instead holds bullish structure and RSI stabilises above 50, the trend may continue despite the divergence.
All values are hypothetical. Divergence can persist for several swings, and spread, slippage and execution conditions affect any live trade. The example illustrates classification and confirmation, not a forecast or recommendation.
Common RSI mistakes
- Treating RSI above 70 as an automatic sell signal or below 30 as an automatic buy signal.
- Ignoring whether the market is trending, ranging or transitioning.
- Using divergence as though it provides an exact reversal time.
- Confusing failure swings with price-vs-RSI divergence.
- Changing the RSI period or thresholds until historical signals look better, then assuming the settings will generalise.
- Ignoring timeframe, spread, slippage and execution risk when turning indicator observations into trades.
Turn Trading Calculations Into Real Trading Decisions
Use your calculated risk levels, position sizing, and technical analysis together with live forex trading signals and market commentary from The Forex Complex.

Frequently asked questions
What is RSI in forex?
RSI, or the Relative Strength Index, is a 0-100 momentum oscillator based on recent gains and losses. Forex traders use it to assess momentum, conventional overbought/oversold conditions, divergence and trend context.
Is RSI above 70 always a sell signal?
No. RSI above 70 means recent upward momentum has been strong. In an established uptrend, RSI can remain above 70 or revisit that area several times without an immediate reversal.
Is RSI below 30 always a buy signal?
No. Oversold readings can persist during a strong decline. Price confirmation, market structure and risk controls are still needed.
What is the best RSI setting for forex?
There is no universal best setting. Fourteen periods is the common default; shorter settings respond faster and are noisier, while longer settings respond more slowly and smooth more short-term movement.
What does the RSI 50 line mean?
The 50 line is the oscillator midpoint. Sustained readings above 50 mean recent gains dominate the RSI calculation; readings below 50 mean recent losses dominate. It is best used as context rather than a standalone signal.
What is an RSI failure swing?
It is an oscillator-only sequence around the 70/30 zones that ends with RSI breaking a prior RSI swing high or low. It is distinct from divergence, which compares price structure with RSI structure.
Key takeaway
Using RSI well means reading momentum in context. The 70/30 zones, 50 centreline, divergence and failure swings can all add information, but none is a guaranteed reversal or entry signal. Start with market structure and timeframe, use the conventional 14-period RSI as a baseline rather than an optimum, and require price-based confirmation and explicit risk controls before turning an oscillator observation into a trading decision.




 Join Our Free Group

 Twitter