

In this article (13 sections)
- What is the Parabolic SAR indicator?
- How Parabolic SAR is calculated
- Parabolic SAR settings: start, increment and maximum
- How traders read Parabolic SAR dots and flips
- Using Parabolic SAR as a trailing stop
- Parabolic SAR strategy: a risk-aware workflow
- Why Parabolic SAR fits trending markets better than ranges
- Whipsaws and false signals
- Parabolic SAR vs other trend tools
- Worked forex example: how the acceleration factor moves SAR
- Common Parabolic SAR mistakes
- Frequently asked questions
- Key takeaway
Parabolic SAR is a trend-following indicator that plots a moving stop-and-reverse level above or below price. Its acceleration factor makes that level move progressively toward price as a trend extends, so traders often use it for trend context and trailing-stop reference. A flip is not a confirmed reversal: in sideways markets the indicator can switch sides repeatedly and create whipsaws.
What is the Parabolic SAR indicator?
Parabolic SAR was developed by J. Welles Wilder as a time-and-price trend-following tool. It advances a calculated level toward price while a trend persists. In the indicator’s bullish state the SAR is plotted below price; in its bearish state the SAR is plotted above price. When price penetrates the active SAR level under the indicator’s rules, the calculation reverses to the other side. MetaTrader 5 documents the same core placement logic, with SAR below price in an uptrend and above price in a downtrend.
That flip is best treated as an indicator event. It may accompany a trend change, a correction or simply a choppy period. For that reason, Parabolic SAR is generally more useful as a trend-tracking and trailing-reference tool than as a complete entry system by itself.
What “stop and reverse” means
The method continually moves a stop-like reference toward price. If price crosses that reference, SAR changes sides and begins tracking the opposite direction. The phrase “stop and reverse” describes the indicator logic, not a guarantee that a broker order will execute exactly at the plotted SAR level.
How Parabolic SAR is calculated
A simplified conceptual recurrence is:
Simplified formula: Current SAR = Previous SAR + AF × (Extreme Point – Previous SAR)
The extreme point (EP) is the highest high reached during the active uptrend or the lowest low reached during the active downtrend. The acceleration factor (AF) controls how aggressively the SAR moves toward that extreme. When a new trend extreme is recorded, AF typically increases by the configured increment until it reaches the configured maximum.
Platform implementations also apply reversal and clamping rules so SAR is not simply a free-running formula. The formula is therefore most useful for understanding behaviour: the gap between SAR and the extreme point is multiplied by AF, which makes the stop-like reference advance as the trend develops.
The acceleration factor
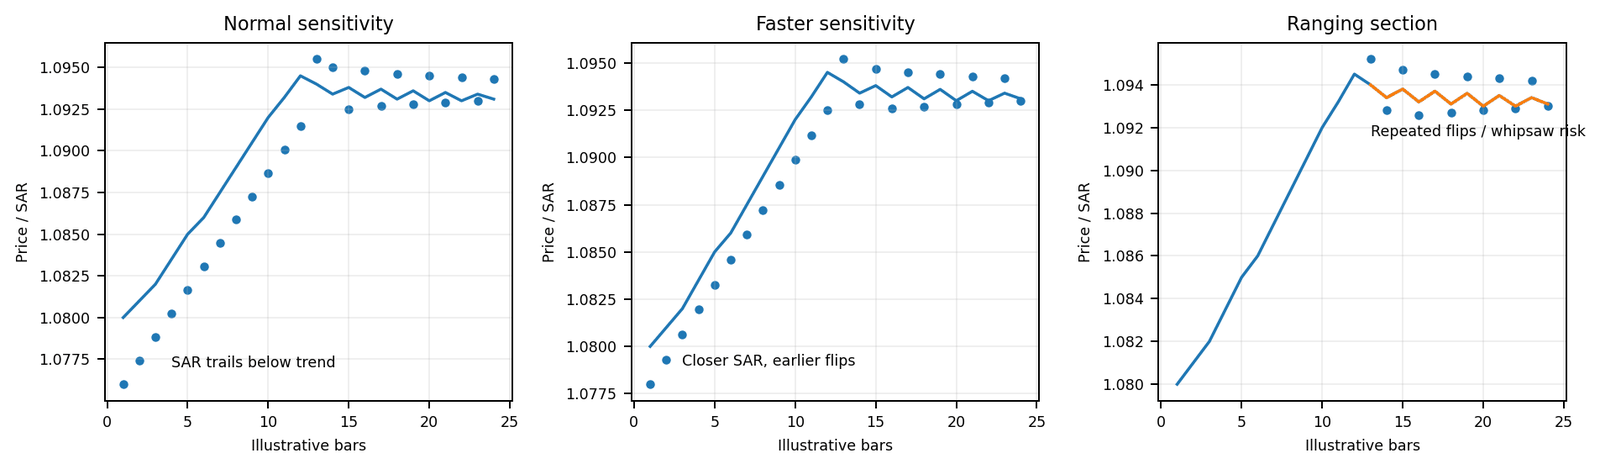
A higher or faster acceleration factor makes SAR approach price more quickly. This can react sooner to a change, but it also increases sensitivity to short-term fluctuations. A lower or slower setting gives price more room, but it can react later when a genuine trend change occurs. Neither setting direction is universally better.
Parabolic SAR settings: start, increment and maximum
TradingView currently documents the traditional defaults as 0.02 for Start, 0.02 for Increment and 0.20 for Max Value. These are useful baselines for study and testing, not “best” settings for every market or timeframe.
| Input | Common default | What it controls | If increased | Key caveat |
|---|---|---|---|---|
| Start | 0.02 | Initial acceleration factor | SAR begins more sensitively | A baseline, not an optimum |
| Increment | 0.02 | How much AF rises after a new extreme | SAR tightens faster as the trend extends | Can increase flip frequency |
| Maximum | 0.20 | Upper cap on AF | Allows greater maximum sensitivity | Higher cap can make late-trend SAR tighter |
Platform note – checked 29 September 2026: TradingView Help continues to document 0.02 / 0.02 / 0.20 as default Start, Increment and Max Value settings. Other platforms may expose similar inputs under different labels, so screenshots or settings instructions should be verified on the exact app/version used.
How traders read Parabolic SAR dots and flips
| Observation | What it means | What it does not prove |
|---|---|---|
| Dots below price | SAR is tracking the bullish side | That the uptrend must continue |
| Dots above price | SAR is tracking the bearish side | That the downtrend must continue |
| SAR advances toward price | The stop-and-reverse reference is tightening | That a reversal is imminent |
| SAR flips sides | Price crossed the active SAR under the indicator rules | That a durable reversal is confirmed |
During persistent trends, dots can form a visually consistent trailing path. During corrections or sideways periods, the same mechanism can flip repeatedly. The important distinction is between what the indicator has calculated and what the broader market structure subsequently confirms.
Using Parabolic SAR as a trailing stop
A common practical use is to treat the SAR level as an analytical trailing-stop reference. In a long trend, the SAR rises below price; in a short trend, it falls above price. As AF increases, the reference can tighten, reducing the distance price must move to trigger an indicator reversal.
A plotted SAR value is not the same as a guaranteed execution price. If a broker stop order is triggered during a gap, rapid repricing or limited liquidity, the actual fill can differ because of spread, slippage and order-execution rules. The indicator should therefore be separated conceptually from the mechanics of the live order.
Parabolic SAR strategy: a risk-aware workflow
- Identify whether the market is meaningfully trending or ranging before interpreting flips.
- Use the SAR side and its progression as context, not as a standalone instruction to enter.
- Define any additional confirmation in advance, such as market structure or an independent trend-strength measure.
- Define invalidation and exit logic before taking risk rather than after the indicator changes sides.
- Include spread, slippage and realistic stop execution in testing.
- Test the settings and workflow by instrument and timeframe rather than assuming the defaults generalise.
Not a standalone signal: A SAR flip can occur because a trend ended, because price entered a correction, or because a range produced another whipsaw. The indicator event is only one piece of evidence.
Why Parabolic SAR fits trending markets better than ranges
| Market condition | Typical SAR behaviour | Main risk | Useful confirmation question |
|---|---|---|---|
| Persistent trend | Dots often trail one side for longer | Late flip may give back part of the move | Is price structure still directional? |
| Range / chop | Frequent side changes | Whipsaw and repeated transaction costs | Is there sustained swing progression? |
| Transition | First flip may appear near regime change | Premature reversal assumption | Does follow-through confirm a new structure? |
Parabolic SAR is designed around directional movement. In a range, price can repeatedly cross the advancing level without producing sustained follow-through. Faster settings may amplify this sensitivity; slower settings can reduce responsiveness but may leave more distance to price during a real reversal.
Whipsaws and false signals
A whipsaw is a sequence of reversals or flips that fails to develop into a sustained directional move. It is a central limitation of Parabolic SAR because the indicator must keep advancing its stop-like level even when the market has lost a clean trend.
- Tighter settings can increase sensitivity to short-term noise.
- Slower settings can delay the flip and leave more of an existing move exposed before the indicator changes sides.
- A trend-strength or market-structure filter can add context but cannot eliminate false signals.
- Backtests that trade every flip without realistic costs can materially overstate what is achievable live.
Parabolic SAR vs other trend tools
| Tool | Primary role | What it can show | What it does not guarantee |
|---|---|---|---|
| Parabolic SAR | Direction / stop-and-reverse reference | Trend side, advancing trailing reference, flips | Trend strength or profitable reversal |
| Moving average | Smoothed price trend reference | Direction and central tendency | Exact reversal timing |
| ADX / Directional Movement | Trend-strength context | Strength of directional movement | A stop level or future direction by itself |
This distinction matters because SAR is sometimes described as if it measures trend strength. Its core role is trend tracking and stop-and-reverse logic; a separate tool such as ADX addresses a different question.
Worked forex example: how the acceleration factor moves SAR
Consider an illustrative EUR/USD uptrend. Previous SAR = 1.0800, current extreme point = 1.1000 and the previous acceleration factor = 0.04. This example uses the simplified recurrence before platform-specific clamping or reversal rules.
Step 1: Distance to the extreme point = 1.1000 – 1.0800 = 0.0200.
Step 2: AF contribution = 0.04 × 0.0200 = 0.0008.
Step 3: Illustrative next SAR = 1.0800 + 0.0008 = 1.0808.
If price later records a new trend high, AF may increase by the configured increment for a subsequent calculation, subject to the maximum. The calculation illustrates why SAR can accelerate toward price during an extended trend: as AF rises, the stop-like level can close the distance more quickly.
The 1.0808 value is an indicator reference, not a guaranteed trade fill. A real stop triggered during a gap or fast market may execute elsewhere because live fills depend on available prices, spread, liquidity and slippage.
Common Parabolic SAR mistakes
- Treating every flip as a confirmed market reversal.
- Using one setting across every pair and timeframe without testing.
- Applying SAR to a range as though it were designed for mean-reverting chop.
- Confusing the displayed SAR level with a guaranteed broker fill price.
- Ignoring spread, slippage or gaps in examples and backtests.
- Optimising settings on one historical sample and presenting them as universal.
- Describing SAR as a trend-strength indicator rather than a trend-tracking / stop-and-reverse tool.
Turn Trading Calculations Into Real Trading Decisions
Use your calculated risk levels, position sizing, and technical analysis together with live forex trading signals and market commentary from The Forex Complex.

Frequently asked questions
What is Parabolic SAR used for?
It is mainly used to track trend direction, provide a moving stop-and-reverse reference and help trail exits. It does not directly measure trend strength and should not be treated as a standalone guarantee of a reversal.
What do Parabolic SAR dots above or below price mean?
Dots below price mean the indicator is on its bullish side; dots above price mean it is on its bearish side. A switch occurs when price crosses the active SAR level under the indicator rules.
What are the default Parabolic SAR settings?
TradingView’s current Parabolic SAR Strategy documentation also uses 0.02 Start, 0.02 Increment and 0.20 Maximum acceleration factor as the default baseline. These are defaults for study and testing, not settings proven best for every market or timeframe.
Why does Parabolic SAR whipsaw in ranges?
In sideways markets, price can cross the advancing SAR repeatedly without developing a sustained trend. That can create frequent flips, especially with more sensitive settings.
Can Parabolic SAR be used as a trailing stop?
Yes. Traders often use the SAR level as a trailing-stop reference. However, a broker stop order can fill away from the displayed level during gaps, fast markets or limited liquidity.
Does Parabolic SAR predict trend reversals?
No. It reacts to price and time under its formula. A flip can flag a possible change, but a correction or range can also trigger it, so additional context is usually needed.
Key takeaway
Parabolic SAR is most useful as a trend-following, stop-and-reverse framework rather than a self-contained trading system. Its acceleration factor explains why the dots tighten toward price, while its main weakness is the tendency to whipsaw when price is not trending cleanly. Treat default settings as a baseline, distinguish indicator flips from confirmed reversals, and separate the plotted SAR level from actual order execution.




 Join Our Free Group

 Twitter