

In this article (12 sections)
- What is divergence in trading?
- Regular vs hidden divergence
- Divergence cheat sheet: price vs indicator structure
- How to identify divergence with RSI
- How to identify divergence with MACD
- Confirmation: what should happen after divergence?
- Regular divergence as a potential reversal warning
- Hidden divergence as a trend-continuation clue
- Divergence trading framework: entry, invalidation and risk
- False signals and common divergence mistakes
- Worked forex example: regular bullish divergence
- Frequently asked questions
Divergence occurs when price and a momentum indicator form different swing structures. Regular divergence is commonly read as a warning that the current move may be losing momentum, while hidden divergence is usually assessed in trend-continuation context. Neither is confirmation by itself, so the price pivots and oscillator pivots must match in time and the later price action still matters.
What is divergence in trading?
Divergence trading compares corresponding price swings with corresponding swings in a momentum indicator. Bullish divergence is identified from lows; bearish divergence is identified from highs. The comparison only makes sense when the price pivot and indicator pivot refer to the same part of the chart.
Divergence is therefore an observation about disagreement between price structure and momentum, not a forecast. Price can continue in the original direction after divergence appears, and a visually persuasive divergence can fail if the underlying price structure does not confirm it.
Regular vs hidden divergence
Regular divergence is most often used as a potential reversal warning. Hidden divergence is most often used as a continuation clue within an established trend. The words bullish and bearish describe the direction implied by the structure, not certainty about what price will do next.
| Type | Price structure | Indicator structure | Typical context | Main caution |
|---|---|---|---|---|
| Regular bullish | Lower low | Higher low | Possible weakening of downside momentum | Not an automatic buy signal |
| Regular bearish | Higher high | Lower high | Possible weakening of upside momentum | Not an automatic sell signal |
| Hidden bullish | Higher low | Lower low | Potential continuation within an uptrend | Trend context must still be intact |
| Hidden bearish | Lower high | Higher high | Potential continuation within a downtrend | Trend context must still be intact |
Regular bullish divergence
Price makes a lower low while the oscillator makes a higher low. That mismatch can indicate that downside momentum is weakening even though price has printed a new low. It is a warning condition, not a standalone long entry.
Regular bearish divergence
Price makes a higher high while the oscillator makes a lower high. The weaker oscillator high can indicate fading upside momentum, but price may still continue higher before any reversal develops.
Hidden bullish divergence
Price forms a higher low while the oscillator forms a lower low. In an established uptrend, the relationship can be interpreted as a possible continuation clue after a corrective move.
Hidden bearish divergence
Price forms a lower high while the oscillator forms a higher high. In an established downtrend, the relationship can be interpreted as a possible continuation clue after a correction.
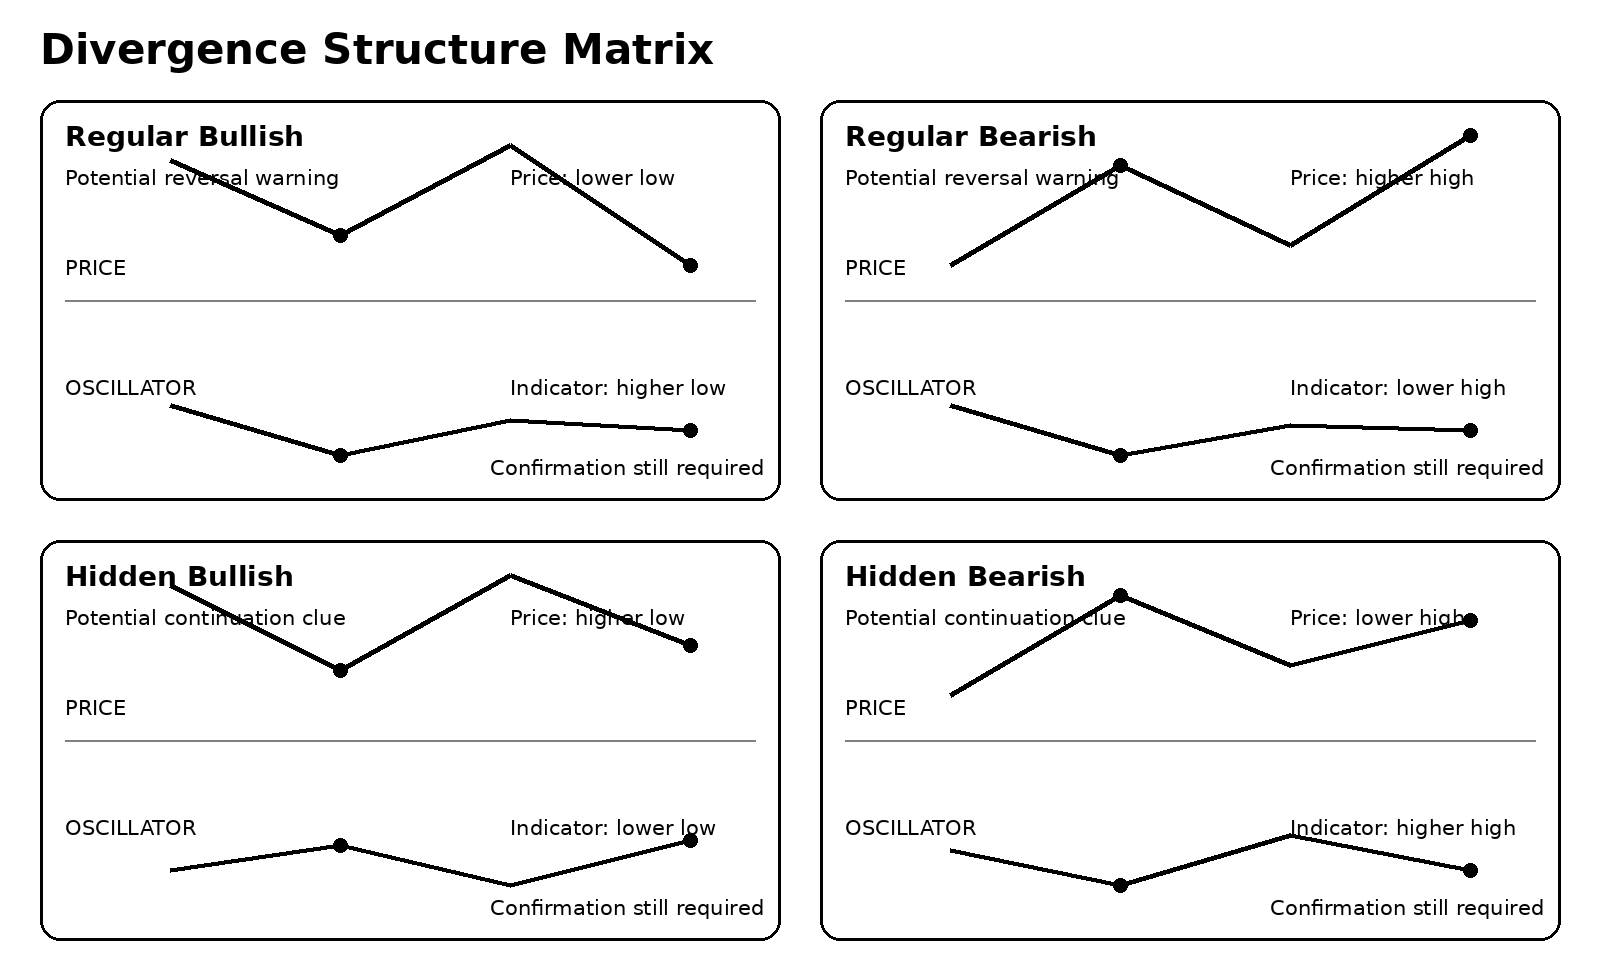
Divergence cheat sheet: price vs indicator structure
- Regular bullish: compare price lows. Price makes a lower low; the oscillator makes a higher low.
- Regular bearish: compare price highs. Price makes a higher high; the oscillator makes a lower high.
- Hidden bullish: compare lows in an uptrend. Price makes a higher low; the oscillator makes a lower low.
- Hidden bearish: compare highs in a downtrend. Price makes a lower high; the oscillator makes a higher high.
- Do not compare a price low with an indicator high or connect pivots that occur at materially different times.
How to identify divergence with RSI
The Relative Strength Index (RSI) is a bounded momentum oscillator that runs from 0 to 100. A 14-period RSI is the common baseline in both MetaTrader 5 documentation and TradingView, but divergence logic depends on matched swing structure rather than on a universally optimal RSI length.
To identify RSI divergence, mark the relevant price highs or lows first, then compare the RSI highs or lows at the same times. Regular bullish divergence, for example, requires a lower low in price and a higher low in RSI. Hidden bullish divergence requires a higher low in price and a lower low in RSI within an established uptrend.
RSI divergence does not require RSI to be below 30 or above 70. Those thresholds are separate information. Confirmation should come from price structure rather than from the divergence line alone.
How to identify divergence with MACD
MACD compares moving-average relationships rather than using a fixed 0-100 scale. In MetaTrader 5, MACD is calculated from 12- and 26-period EMAs with a 9-period signal line. Other platforms can present the histogram and signal line differently, so a divergence example should state exactly which MACD component is being compared.
If price is compared with the MACD line, use the MACD line consistently for both pivots. If an example uses the histogram, do not switch to the line for the second pivot simply because it produces a more attractive divergence. That would change the evidence mid-analysis.
| Indicator | What is compared | Strength | Limitation | Implementation note |
|---|---|---|---|---|
| RSI | Price pivots vs RSI pivots | Bounded scale makes swing comparison intuitive | Can diverge while trend persists | 14 periods is a common baseline, not a universal optimum |
| MACD | Price pivots vs one chosen MACD component | Shows changes in momentum relative to moving averages | Line/histogram choice can change the visual result | State the exact component and platform |
Confirmation: what should happen after divergence?
Divergence is not the confirmation event. It can appear early and persist while price continues in the original direction. The article framework therefore separates the divergence observation from a later price-based condition.
- Define the market context first: trend, range or transition.
- For a reversal-style example, identify an interim swing level or another clear price-structure threshold before the trade idea is considered confirmed.
- For hidden divergence, verify that the broader trend structure is still intact before describing the setup as a continuation clue.
- If candlestick behaviour is used, treat it as additional context rather than an infallible trigger.
- Define the confirmation rule before looking at the outcome, rather than choosing it retrospectively.
Regular divergence as a potential reversal warning
Regular divergence can show that momentum is not confirming a new price extreme. That can be useful as an early warning, but weakened momentum does not force an immediate reversal. Strong trends can continue through several divergences, and multiple divergences should not automatically be treated as linearly stronger evidence.
A better framework is to separate three questions: Is the divergence classified correctly? Has the price structure actually changed? What would invalidate the reversal idea if price continues in the original direction?
Hidden divergence as a trend-continuation clue
Hidden divergence belongs in trend context. Hidden bullish divergence is normally interpreted when price keeps a higher low within an uptrend while the oscillator makes a lower low. Hidden bearish divergence is the mirror image inside a downtrend.
If the underlying trend structure has already broken, calling the relationship hidden continuation divergence can be misleading. The oscillator mismatch is only useful when the price structure still supports the continuation thesis, and that thesis can still fail.
Divergence trading framework: entry, invalidation and risk
- Classify the divergence: regular or hidden, bullish or bearish.
- Confirm that the price and oscillator pivots match in time.
- Define the market context before interpreting the divergence.
- Wait for a pre-defined price confirmation rather than entering because two lines can be drawn.
- Define invalidation from the price structure that would make the thesis no longer valid, not from an arbitrary oscillator number.
- Size risk from the distance to invalidation and the trader’s own risk framework.
- Allow for spread and slippage around fast moves; divergence does not remove execution risk.
False signals and common divergence mistakes
| Mistake | Why it is misleading | Better practice |
|---|---|---|
| Connecting unrelated pivots | Creates a visual mismatch that did not occur at comparable points in time | Align price and oscillator pivots bar-for-bar |
| Treating every divergence as a reversal | Divergence can persist while trend continues | Require separate price confirmation |
| Using hidden divergence without a trend | Continuation interpretation loses its structural basis | Verify higher-low or lower-high trend structure first |
| Switching MACD components | Can manufacture a preferred signal | Use the same line or histogram for both pivots |
| Using every oscillator wiggle | Minor noise can dominate the analysis | Focus on meaningful price swings |
| Hindsight selection | Only successful examples are remembered | Define rules before reviewing the outcome |
| Ignoring execution conditions | Fast moves can widen spreads or create slippage | Treat execution as a separate risk |
Worked forex example: regular bullish divergence
Consider a hypothetical EUR/USD decline using a 14-period RSI. The first price swing low is 1.0780 with RSI at 31. Price later falls to a second swing low at 1.0740, while RSI forms a higher low at 36. An interim price swing high sits at 1.0815.
| Observation | Value | Interpretation |
|---|---|---|
| First price low | 1.0780 | Reference low |
| Second price low | 1.0740 | Lower low in price |
| First RSI low | 31 | Reference oscillator low |
| Second RSI low | 36 | Higher low in RSI |
Because price makes a lower low while RSI makes a higher low, the structure meets the definition of regular bullish divergence. The divergence exists at the second swing low, but it is not yet confirmation of a reversal.
For this example only, a later break and close above the 1.0815 interim swing high is used as the separate structural confirmation threshold. If price instead continues lower or fails after that confirmation event, the bullish interpretation weakens or fails. The second price low can serve as one structural reference for invalidation logic, but this example does not prescribe a universal stop distance.
Turn Trading Calculations Into Real Trading Decisions
Use your calculated risk levels, position sizing, and technical analysis together with live forex trading signals and market commentary from The Forex Complex.

Frequently asked questions
Is divergence a buy or sell signal by itself?
No. Divergence describes a mismatch between price and a momentum indicator. It can appear early, persist for several swings or fail, so a separate price-based confirmation rule is needed before treating it as actionable evidence.
What is the difference between regular and hidden divergence?
Regular divergence is commonly used as a possible reversal warning, while hidden divergence is commonly interpreted in trend-continuation context. For example, regular bullish divergence is price lower low plus indicator higher low; hidden bullish divergence is price higher low plus indicator lower low within an uptrend.
Can hidden bullish divergence appear in a downtrend?
The geometry can appear, but the usual continuation interpretation becomes questionable if the broader price structure is still a downtrend. Hidden bullish divergence is normally interpreted within an established uptrend where price is holding a higher low.
Which RSI setting is used for divergence?
A 14-period RSI is a common baseline and is documented as the standard/default in major platforms such as TradingView and MetaTrader 5. The divergence concept itself depends on matched swing structure, not on a universally best RSI period.
Can MACD show divergence?
Yes. Price can diverge from MACD momentum, but the analysis should specify whether it uses the MACD line or the histogram and keep that choice consistent across both comparison pivots.
Why does divergence sometimes fail?
Momentum can weaken without price reversing, trends can continue through several divergences, pivots can be selected incorrectly and the later confirmation can fail. Divergence is therefore context, not certainty.




 Join Our Free Group

 Twitter