

In this article (14 sections)
- What is the Williams %R indicator?
- How is Williams %R calculated?
- How to read -20 and -80 on Williams %R
- Williams %R in trending markets vs ranging markets
- What is a Williams %R momentum failure?
- Williams %R divergence
- Williams %R settings: what does the lookback period change?
- Williams %R indicator in MT4
- Williams %R vs stochastic oscillator
- A practical Williams %R reading framework
- Worked forex example: 14-period Williams %R at -20
- Common Williams %R mistakes
- Frequently asked questions
- Key takeaway
Williams Percent Range (%R) is a momentum oscillator that shows where the current close sits within the recent high-low range. It runs from 0 to -100, with -20 and -80 commonly used as overbought and oversold reference levels. Those zones are context markers, not automatic reversal signals: in a strong trend, %R can remain near an extreme while price continues in the same direction.
What is the Williams %R indicator?
Williams %R, developed by Larry Williams, is a bounded momentum oscillator that compares the latest close with the highest high and lowest low over a chosen lookback. TradingView documents 14 periods as the conventional default, with 0 to -20 treated as the upper extreme and -80 to -100 as the lower extreme.
The indicator measures range position and momentum context. It does not forecast a future price level, and a threshold touch does not establish that a reversal must follow.
How is Williams %R calculated?
Williams %R formula: %R = -100 x (Highest High – Close) / (Highest High – Lowest Low)
Highest High and Lowest Low are taken from the selected lookback window, while Close is the current bar close. The explicit minus sign creates the familiar 0 to -100 scale.
- Find the highest high over the selected lookback.
- Find the lowest low over the same lookback.
- Measure how far the current close sits below the highest high.
- Divide that distance by the full high-low range and multiply by -100.
Why the scale matters: A reading of -10 is nearer the recent high and therefore more overbought by the traditional convention than a reading of -50. A reading of -90 is nearer the recent low and therefore more oversold.
How to read -20 and -80 on Williams %R
| %R zone | Common interpretation | What it does NOT mean | Context check |
|---|---|---|---|
| 0 to -20 | Conventional overbought zone | Price must fall next | Is the market trending strongly or testing a range boundary? |
| Around -50 | Middle of recent range | A formal buy/sell threshold | Is momentum shifting or simply neutral? |
| -80 to -100 | Conventional oversold zone | Price must rebound next | Is the decline persistent or is price near a defined support/range area? |
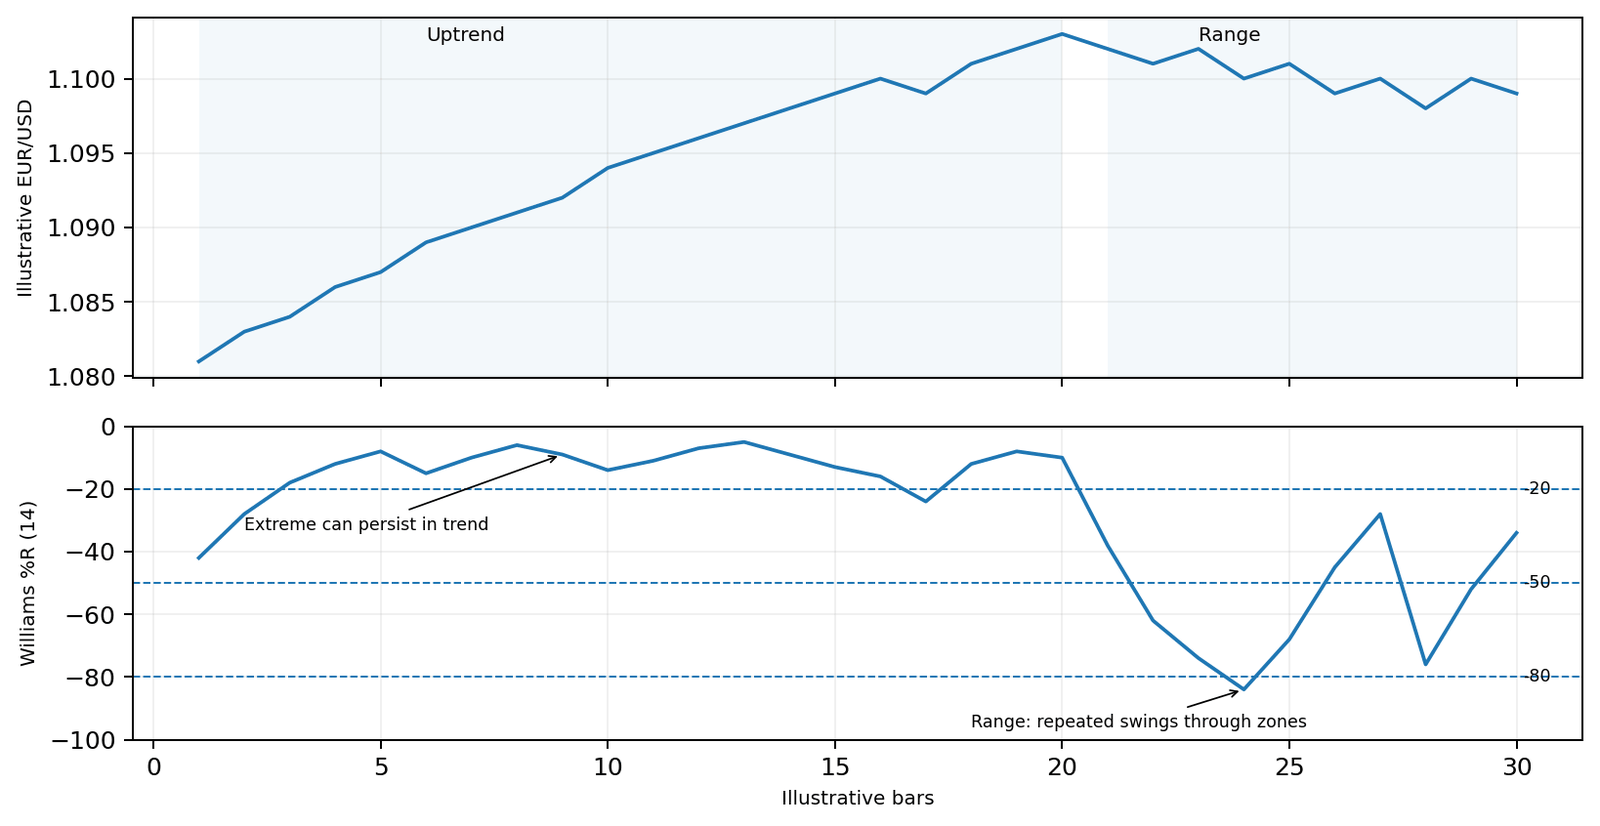
“Overbought” and “oversold” describe where the close sits within the recent range. They are not timing guarantees. In a strong uptrend, repeated readings above -20 can reflect sustained momentum; in a strong downtrend, repeated readings below -80 can persist.
Williams %R in trending markets vs ranging markets
| Market regime | Typical %R behaviour | Useful context | Main failure mode |
|---|---|---|---|
| Uptrend | Frequently reaches or stays near 0 to -20 | Read alongside higher highs/higher lows and pullbacks | Fading every extreme can mean repeated countertrend entries |
| Downtrend | Frequently reaches or stays near -80 to -100 | Read alongside lower highs/lower lows and rallies | Assuming oversold must rebound immediately |
| Range | Oscillator may rotate between extremes more often | Compare readings with clearly defined range boundaries | Threshold crossings can whipsaw if boundaries are unclear |
What is a Williams %R momentum failure?
A momentum failure describes a change in oscillator behaviour after an extreme reading. It is commonly framed as Williams %R leaving an extreme zone, attempting to return, and failing to re-enter that zone.
After an overbought condition
- %R trades in the 0 to -20 area.
- The oscillator drops back below -20.
- It attempts to rally again.
- The rebound fails to re-enter the overbought zone.
After an oversold condition
- %R trades in the -80 to -100 area.
- The oscillator rises back above -80.
- It attempts to fall again.
- The decline fails to re-enter the oversold zone.
A momentum failure can highlight changing momentum behaviour, but it is not proof of a price reversal. Price structure or another clearly defined confirmation rule is still needed.
Williams %R divergence
| Type | Price structure | %R structure | Interpretation | Main limitation |
|---|---|---|---|---|
| Bullish divergence | Lower low | Higher low | Downside momentum may be weakening | Price can continue lower while divergence persists |
| Bearish divergence | Higher high | Lower high | Upside momentum may be weakening | Price can continue higher before any reversal |
Divergence is supporting context rather than a timing signal. Here it is used only to show when price and oscillator momentum disagree; price-based confirmation is still needed before treating that disagreement as actionable.
Williams %R settings: what does the lookback period change?
| Lookback | Responsiveness | Extreme-zone frequency | Main limitation |
|---|---|---|---|
| Shorter than 14 | Faster | Usually more frequent | More sensitive to short-term noise and range fluctuations |
| 14 periods | Baseline | Mainstream default | Common reference only, not an optimum |
| Longer than 14 | Slower | Usually less frequent | Can react later to meaningful momentum changes |
“14 periods” means 14 bars of the active chart. Fourteen 15-minute bars and fourteen daily bars therefore represent very different amounts of market time. Any custom lookback or threshold should be documented consistently in screenshots, examples and backtests.
Williams %R indicator in MT4
Williams’ Percent Range remains a built-in oscillator in MetaTrader 4. The MetaTrader 4 help documentation places it under Insert > Indicators > Oscillators > Williams’ Percent Range. Menu wording and visual properties should still be rechecked against the live installed version before screenshots are published.
The platform lets traders adjust the calculation period and display levels, but the interpretation is unchanged: MT4 displaying -20 or -80 does not make either level a guaranteed reversal signal.
Williams %R vs stochastic oscillator
| Feature | Williams %R | Stochastic Oscillator |
|---|---|---|
| Core idea | Compares the close with the recent high-low range | Also compares the close with the recent high-low range |
| Typical scale | 0 to -100, inverted | 0 to 100 |
| Display structure | Usually one oscillator line | Often includes %K/%D and smoothing depending on implementation |
| Interpretation caution | Extreme readings can persist in trends | Extreme readings can also persist in trends |
The two oscillators are conceptually related, but they are not displayed identically and should not be treated as interchangeable signal systems.
A practical Williams %R reading framework
- Choose the timeframe and classify price as trending, ranging or transitioning.
- Note where Williams %R sits relative to -20 and -80 without treating the level alone as an instruction.
- Ask whether the reading reflects trend momentum, a momentum failure, or divergence against price.
- Look for price confirmation at a meaningful swing or support/resistance area before forming a trade hypothesis.
- Define invalidation, position size and realistic spread/slippage assumptions before any entry; oscillator readings do not cap loss or guarantee fills.
Risk-aware use: Williams %R can organise momentum information, but false signals, whipsaws and execution risk remain. Treat it as one input within a broader price and risk framework.
Worked forex example: 14-period Williams %R at -20
Consider an illustrative EUR/USD 1-hour chart using a 14-period Williams %R. Over the latest 14 completed bars, the highest high is 1.0900, the lowest low is 1.0800 and the current close is 1.0880.
| Input | Illustrative value |
|---|---|
| Highest high (14 bars) | 1.0900 |
| Lowest low (14 bars) | 1.0800 |
| Current close | 1.0880 |
| Traditional reference levels | -20 / -80 |
%R = -100 x (1.0900 – 1.0880) / (1.0900 – 1.0800) = -100 x 0.0020 / 0.0100 = -20.
The close is therefore near the upper end of the 14-bar range and sits exactly on the conventional overbought reference. That shows strong recent positioning near the range high; it does not prove EUR/USD is about to fall.
If price is already in an established uptrend and structure remains intact, Williams %R could stay near the upper extreme. A reversal hypothesis would require separate price confirmation or a clearly defined momentum-failure/divergence condition.
All values are hypothetical. A single oscillator reading does not forecast the next bar, and live results also depend on spread, slippage, volatility, order type and risk management.
Common Williams %R mistakes
- Treating a reading above -20 as an automatic sell signal or below -80 as an automatic buy signal.
- Forgetting that the scale is inverted and misreading -10 versus -90.
- Ignoring whether the market is trending or ranging.
- Using divergence or momentum failure as an exact reversal timer.
- Changing the lookback until historical signals look attractive and then assuming the setting generalises.
- Ignoring spread, slippage and execution risk when translating oscillator observations into trades.
Turn Trading Calculations Into Real Trading Decisions
Use your calculated risk levels, position sizing, and technical analysis together with live forex trading signals and market commentary from The Forex Complex.

Frequently asked questions
What is Williams Percent Range?
Williams Percent Range (%R) is a 0 to -100 momentum oscillator that shows where the current close sits within the recent high-low range.
Is Williams %R below -80 a buy signal?
No. Below -80 is conventionally oversold, but strong declines can keep the oscillator there for several bars. Price confirmation and risk controls are still needed.
Is Williams %R above -20 a sell signal?
No. Above -20 is conventionally overbought, but strong uptrends can keep the oscillator near the top of its range.
What is the best Williams %R setting?
There is no universal best setting. Fourteen periods is the common default; shorter settings are more sensitive and longer settings react more slowly.
How is Williams %R different from Stochastic?
Both compare the close with a recent high-low range, but Williams %R uses an inverted 0 to -100 scale while Stochastic is typically shown on a 0 to 100 scale and may include smoothing or signal lines.
Can I use Williams %R in MT4?
Yes. Williams Percent Range is included as a built-in oscillator in MetaTrader 4. Verify the current menu labels and indicator inputs when producing screenshots or instructions.
Key takeaway
Williams %R is most useful when its threshold readings are interpreted in market context. The 0 to -100 scale shows where the close sits within the recent range, while -20/-80 and the 14-period lookback are conventional reference settings rather than guaranteed signals or optimal parameters. Trend/range regime, momentum failure, divergence, price confirmation and explicit risk controls all matter more than a single extreme reading.




 Join Our Free Group

 Twitter