

In this article (12 sections)
- What is a wedge pattern in trading?
- Rising wedge pattern: structure and interpretation
- Falling wedge pattern: structure and interpretation
- Rising wedge vs falling wedge
- Wedge vs triangle: how to tell the patterns apart
- How to confirm a wedge breakout
- Continuation vs reversal: why trend context matters
- How traders frame invalidation for wedge patterns
- False breakouts and failed wedge patterns
- Worked forex example: rising wedge breakout and failure
- Common wedge pattern mistakes
- Frequently asked questions
A rising wedge is a chart pattern formed by two upward-sloping, converging trendlines, while a falling wedge uses two downward-sloping, converging trendlines. Rising wedges are commonly interpreted as bearish and falling wedges as bullish, but the shape alone does not confirm what price will do next. In this article, a breakout is treated as confirmed only after a candle closes beyond the relevant wedge boundary; even then, the move can fail.
What is a wedge pattern in trading?
A wedge is a narrowing price structure bounded by two converging trendlines that slope in the same general direction. In a rising wedge, both boundaries rise. In a falling wedge, both boundaries fall. The distance between the boundaries contracts as successive swing highs and swing lows compress.
The pattern can appear after an extended directional move or as a corrective phase inside a broader trend. That is why the same wedge geometry can be interpreted as either a potential reversal or a potential continuation structure depending on the prior trend. The pattern should be drawn from observable swing points rather than by forcing trendlines to fit an expected outcome.
Rising wedge pattern: structure and interpretation
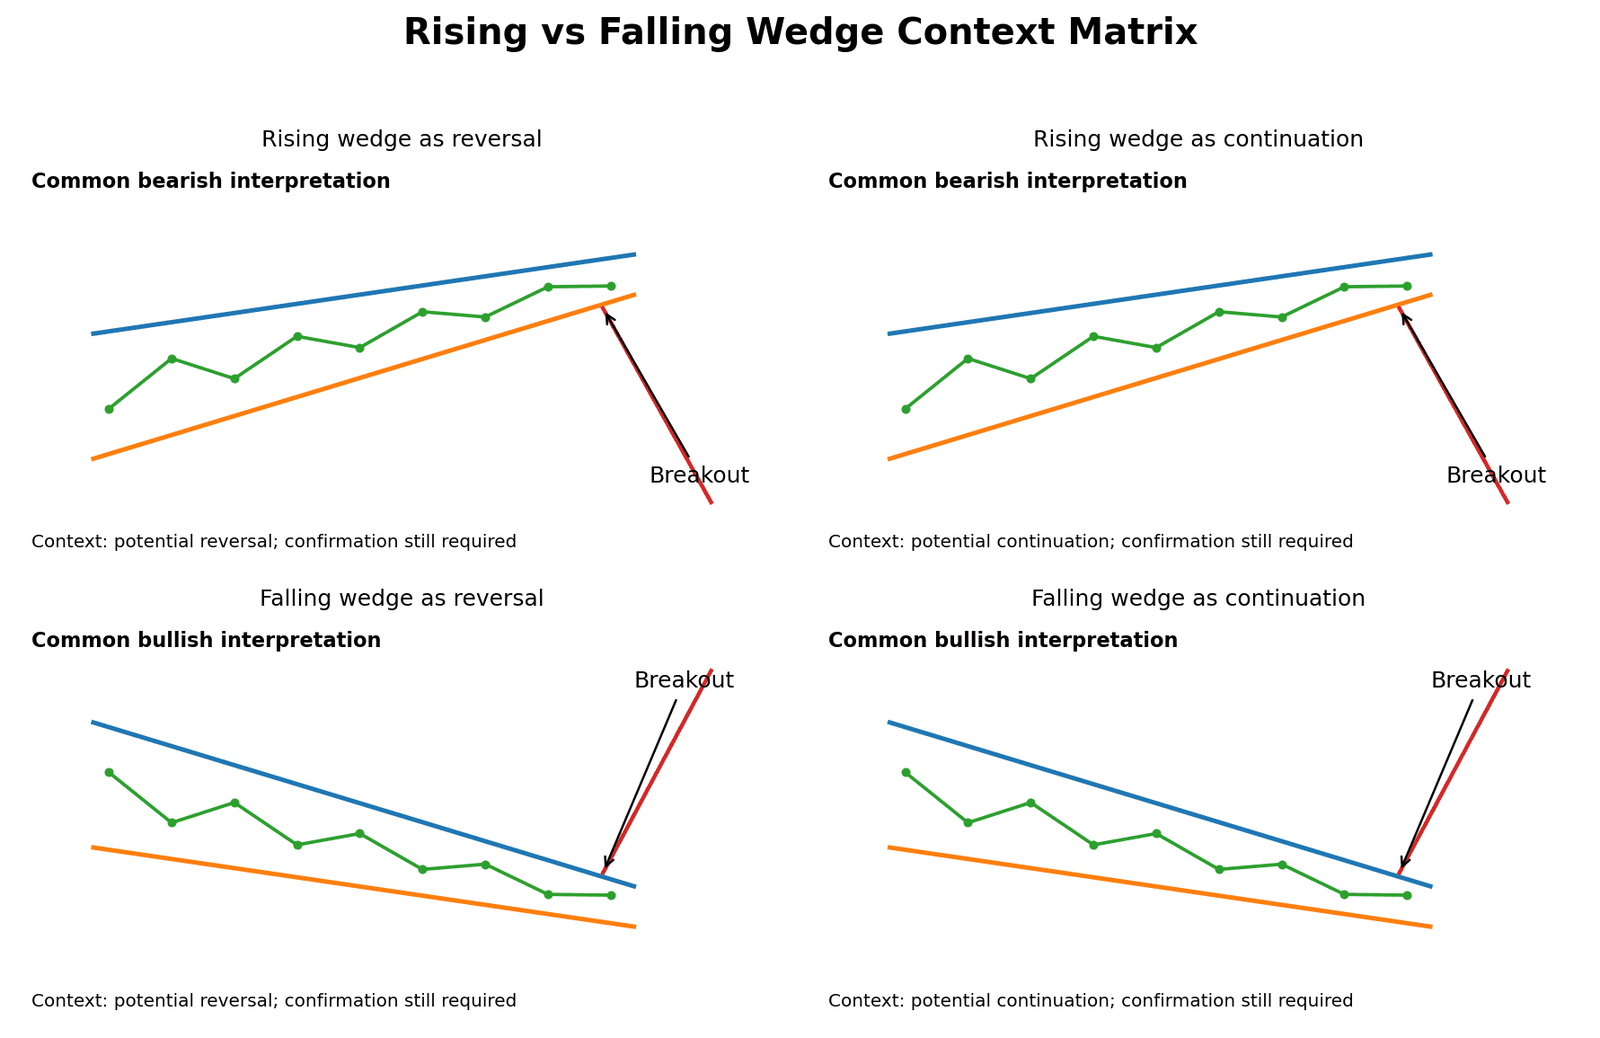
A rising wedge contains higher swing highs and higher swing lows inside two upward-sloping trendlines that converge. The lower boundary often rises faster than the upper boundary, so upward progress becomes progressively more compressed. That geometry is commonly given a bearish interpretation, but a bearish outcome still has to be observed rather than assumed.
For the examples in this article, a rising wedge is not treated as confirmed until price closes below its lower boundary. A wick through the line by itself is not enough under this chosen convention.
Rising wedge as a reversal pattern
When a rising wedge develops after an advance, a confirmed downside break can be interpreted as a potential reversal of the preceding rise. The logic is structural: price is still making higher highs and higher lows, but the range is narrowing and upward progress is weakening. A close below the lower trendline changes that structure, although it does not guarantee sustained downside follow-through.
Rising wedge as a continuation pattern
A rising wedge can also form during a broader decline. In that setting, the wedge may represent an upward-sloping corrective phase rather than a market top. If price later confirms a downside break, the move may be interpreted as potential continuation of the broader downtrend. The same shape therefore has to be read together with the prior trend.
Falling wedge pattern: structure and interpretation
A falling wedge contains lower swing highs and lower swing lows inside two downward-sloping, converging trendlines. The upper boundary often falls faster than the lower boundary, so the decline becomes progressively less expansive. The common interpretation is bullish, but an upside outcome is not guaranteed and downside failures can occur.
Using the same confirmation framework as the rising wedge, the examples here treat a falling wedge as confirmed only after price closes above its upper boundary.
Falling wedge as a reversal pattern
After a sustained decline, a falling wedge can be interpreted as a potential bullish reversal structure if price closes above the upper boundary. The wedge geometry suggests that downward movement is compressing, but the actual breakout and subsequent price behaviour determine whether that interpretation remains valid.
Falling wedge as a continuation pattern
Inside a broader uptrend, a falling wedge may represent a downward corrective phase. An upside break can then be interpreted as possible continuation of the wider advance. The pattern is still only a framework: price can fail at the breakout, remain range-bound or break the opposite side.
Rising wedge vs falling wedge
| Feature | Rising wedge | Falling wedge | Key qualification |
|---|---|---|---|
| Boundary direction | Both slope upward | Both slope downward | Convergence matters more than perfect symmetry |
| Common bias | Bearish | Bullish | Bias is not confirmation |
| Typical watched break | Below lower trendline | Above upper trendline | Opposite-side breaks can occur |
| Reversal context | Often after an advance | Often after a decline | Prior trend must be stated |
| Continuation context | Corrective rise in broader downtrend | Corrective decline in broader uptrend | Same geometry can serve different roles |
| Failure example | Upside break or quick reclaim after downside break | Downside break or quick rejection after upside break | Failure should be planned for, not treated as an exception |
Wedge vs triangle: how to tell the patterns apart
Wedges and triangles both compress price between converging boundaries, but their boundary orientation is different. In a wedge, both boundaries generally slope in the same direction. A symmetrical triangle has one falling boundary and one rising boundary, while ascending and descending triangles usually combine one sloping boundary with one approximately horizontal boundary.
| Feature | Wedge | Triangle | Why it matters |
|---|---|---|---|
| Boundary orientation | Both boundaries slope in the same direction | Opposite slopes or one horizontal side | Prevents misclassification |
| Core visual idea | Directional compression | Compression around converging support/resistance | Both narrow, but the geometry differs |
| Directional assumption | Common bias exists, but breakout must confirm | Depends on triangle subtype and actual break | Do not classify from expected direction alone |
| Context | Can be reversal or continuation | Can also appear in different trend contexts | Prior trend still matters |
How to confirm a wedge breakout
Breakout confirmation should be defined before the pattern is used in a trading plan. This article uses a candle close beyond the relevant wedge boundary as its working convention. That makes the examples consistent, but it is not a universal market rule.
- Identify the wedge boundaries from the swing structure before the breakout occurs.
- Distinguish a brief intrabar trendline breach from a completed close beyond the line.
- Apply the same confirmation rule to every example rather than changing the rule after the fact.
- If a retest is part of the framework, define in advance whether a return to the broken line is acceptable or invalidating.
- Reassess the pattern if price returns decisively inside the wedge or breaks the opposite boundary.
| Method | Trigger | Advantage | Limitation |
|---|---|---|---|
| Close beyond boundary | Candle closes outside the wedge | Reduces sensitivity to brief wicks | Confirmation arrives later |
| Distance filter | Price closes a defined distance beyond the line | Adds an extra buffer | Filter choice can be arbitrary without evidence |
| Breakout + retest | Break occurs, then price retests the boundary | Adds structural information after the break | Retest may never occur or may fail |
Continuation vs reversal: why trend context matters
| Pattern | Prior trend | Common interpretation | Confirmation needed |
|---|---|---|---|
| Rising wedge | Advance | Potential bearish reversal | Close below lower boundary under this article’s convention |
| Rising wedge | Broader decline | Potential bearish continuation | Close below lower boundary |
| Falling wedge | Decline | Potential bullish reversal | Close above upper boundary |
| Falling wedge | Broader advance | Potential bullish continuation | Close above upper boundary |
These are interpretations, not outcomes. A rising wedge can break upward, a falling wedge can break downward, and either can produce a confirmed breakout that later fails.
How traders frame invalidation for wedge patterns
Invalidation is the point at which the evidence no longer supports the original wedge-breakout thesis. It should be defined from observable structure rather than from the pattern label alone.
- For a downside break from a rising wedge, a sustained return inside the wedge can weaken or invalidate the bearish breakout thesis.
- For an upside break from a falling wedge, a sustained return inside the wedge can weaken or invalidate the bullish breakout thesis.
- A break through the opposite wedge boundary can provide a broader structural invalidation reference.
- A retest of the broken trendline is not automatically invalidation if the framework explicitly allows retests.
- Pattern invalidation is separate from personal position sizing and from the exact placement of a protective stop order.
False breakouts and failed wedge patterns
A false breakout occurs when price moves beyond the expected wedge boundary but fails to sustain the move. Under a close-based framework, failure can still happen after an apparently confirmed close.
| Failure scenario | What happens | Why the interpretation changes |
|---|---|---|
| Brief boundary breach | Price moves outside intrabar and closes back inside | The chosen close-based rule was never satisfied |
| Confirmed break then reclaim | Price closes outside, then returns decisively inside | Follow-through failed and the breakout thesis weakens |
| Rising wedge breaks upward | Price exits through the upper boundary | Common bearish interpretation is contradicted by observed price action |
| Falling wedge breaks downward | Price exits through the lower boundary | Common bullish interpretation is contradicted |
| Retest failure | Price revisits the broken boundary and reverses back through it | The broken line does not hold as expected |
In forex, spreads can widen and slippage can increase during volatile conditions, so the executed price may differ from a clean chart level. Those execution effects complicate the trade outcome but do not, by themselves, explain every failed pattern.
Worked forex example: rising wedge breakout and failure
Illustrative example: The prices below are hypothetical and are used only to explain pattern logic.
Assume EUR/USD advances and then forms a rising wedge. The upper boundary rises from about 1.1050 to 1.1090. The lower boundary rises more steeply from about 1.0970 to 1.1060. Price later closes below the lower boundary near 1.1050.
Under this article’s close-based convention, that close is the confirmation event. The key observation is the shift from upward-sloping compression to a confirmed break of the lower support boundary. It supports a bearish hypothesis, but it does not establish a guaranteed target.
One structural invalidation rule could treat a sustained move back inside the wedge as failure. A broader rule could wait for price to break the opposite boundary. Which rule is used changes the risk distance and the timing of the invalidation.
Now consider the failure case: EUR/USD closes below the lower boundary, trades lower briefly, then rapidly returns inside the wedge and later breaks the upper boundary. The original bearish interpretation has failed. The example also ignores variable spreads, slippage and intrabar volatility, all of which can make real execution differ from the simplified chart geometry.
Common wedge pattern mistakes
- Forcing trendlines through poorly aligned swing points to make the pattern look cleaner than it is.
- Calling any narrowing channel a wedge without checking whether the boundaries actually converge.
- Confusing a wedge with a triangle because both involve price compression.
- Assuming a rising wedge must break lower or a falling wedge must break higher.
- Ignoring the prior trend when deciding whether the wedge is being interpreted as continuation or reversal.
- Treating an intrabar trendline breach as confirmed without first defining the confirmation rule.
- Ignoring false breakouts and failing to define invalidation before the breakout occurs.
- Copying a textbook stop location without considering timeframe, volatility and the actual thesis.
Turn Trading Calculations Into Real Trading Decisions
Use your calculated risk levels, position sizing, and technical analysis together with live forex trading signals and market commentary from The Forex Complex.

Frequently asked questions
Are rising wedges always bearish?
No. A rising wedge has a common bearish interpretation because the upward move is compressing, but price can break upward or a downside breakout can fail. The pattern should be treated as a hypothesis until the chosen breakout rule is satisfied and follow-through is observed.
Are falling wedges always bullish?
No. A falling wedge is commonly interpreted as bullish, but downside breaks and failed upside breakouts occur. The shape describes compression; it does not guarantee the breakout direction or outcome.
Can a rising wedge be a continuation pattern?
Yes. A rising wedge can form as an upward corrective structure inside a broader downtrend. If price later confirms a downside break, traders may interpret the move as potential continuation of the wider decline rather than a reversal from an uptrend.
Can a falling wedge be a continuation pattern?
Yes. A falling wedge can form as a downward corrective structure inside a broader uptrend. An upside break may then be interpreted as potential continuation of the wider advance, but that outcome still requires confirmation and can fail.
What is the difference between a wedge and a triangle?
In a wedge, both converging boundaries generally slope in the same direction. A symmetrical triangle has one falling and one rising boundary, while ascending and descending triangles usually have one approximately horizontal side. Both families compress price, so boundary orientation is the key visual distinction.
What is a false breakout from a wedge?
A false breakout is a move beyond a wedge boundary that fails and returns inside the structure. It can occur after a brief intrabar breach or even after a close beyond the line. A later break in the opposite direction is also possible.




 Join Our Free Group

 Twitter