

In this article (12 sections)
- What is Ichimoku Kinko Hyo?
- The five Ichimoku components explained
- How the Kumo cloud is built and read
- Why is the Ichimoku cloud plotted forward?
- Tenkan-sen and Kijun-sen crossovers
- Price vs cloud signals
- How Chikou Span is used as confirmation
- Standard Ichimoku settings: 9 / 26 / 52 / 26
- Ichimoku in trending vs ranging markets
- A practical Ichimoku analysis framework
- Worked forex example: multi-component alignment
- Frequently asked questions
Ichimoku Kinko Hyo is a five-component charting framework used to organise trend, support/resistance and market-balance context in one view. Its Kumo cloud is formed by Senkou Span A and Senkou Span B, while Tenkan-sen, Kijun-sen and Chikou Span add shorter-term, baseline and lagging context. The framework is multi-component: no single crossover, cloud break or Chikou relationship guarantees a reversal, continuation or profitable trade.
What is Ichimoku Kinko Hyo?
Ichimoku Kinko Hyo is a price-chart framework that combines five lines with a shaded cloud. Rather than reducing the market to one oscillator reading, it places several relationships on the same chart: short-term range midpoint, medium-term range midpoint, two forward-displaced cloud boundaries and the current close plotted backward. Traders use those relationships to describe trend context, equilibrium, potential support/resistance zones and confirmation. The conventional component calculations and forward/backward displacement are documented in TradingView’s Ichimoku Cloud guide.
Because all five components come from price data, Ichimoku is descriptive and lagging to different degrees. As with other technical analysis tools, it can make alignment easier to see, but it does not remove uncertainty or execution risk.
The five Ichimoku components explained
| Component | Conventional calculation | Plot location | Main analytical role | Key limitation |
|---|---|---|---|---|
| Tenkan-sen / Conversion Line | (Highest high + lowest low) / 2 over 9 periods | Current | Shorter-term range midpoint and direction context | Can flatten or cross frequently in ranges |
| Kijun-sen / Base Line | (Highest high + lowest low) / 2 over 26 periods | Current | Medium-term baseline / equilibrium reference | Still historical and may lag rapid changes |
| Senkou Span A | (Tenkan + Kijun) / 2 | 26 periods forward | One Kumo boundary; shorter cloud input | Forward plotting is not prediction |
| Senkou Span B | (Highest high + lowest low) / 2 over 52 periods | 26 periods forward | Second Kumo boundary; slower cloud input | Can stay flat for long stretches |
| Chikou Span / Lagging Span | Current closing price | 26 periods backward | Visual comparison with earlier price / cloud context | Can become cluttered in congested markets |
Tenkan, Kijun and Senkou Span B are high-low range midpoints, not moving averages of closing prices. MetaTrader 5’s Ichimoku documentation uses the same high-low midpoint construction for the standard lines.
How the Kumo cloud is built and read
The Kumo is the area between Senkou Span A and Senkou Span B. It is usually read as a zone rather than an exact line. Price above the cloud commonly supports bullish trend context; price below it supports bearish context; price inside the cloud suggests mixed or non-trending conditions where directional signals are less clear.
| Price location | Common interpretation | Confirmation check | Main failure risk |
|---|---|---|---|
| Above Kumo | Bullish trend context | Check cloud direction, Tenkan/Kijun relationship and price structure | Failed breakout or return into cloud |
| Inside Kumo | Mixed / transitional context | Wait for clearer price structure or sustained close beyond cloud | Whipsaw and contradictory signals |
| Below Kumo | Bearish trend context | Check cloud direction, Tenkan/Kijun relationship and price structure | Failed breakdown or recovery into cloud |
A cloud twist occurs when Senkou Span A and Senkou Span B cross in the forward-plotted area. It is an observable change in the cloud geometry, not a standalone forecast. Cloud thickness likewise shows the distance between the two spans; it should not be converted into an unsupported “strength score.”
Why is the Ichimoku cloud plotted forward?
Senkou Span A and B are shifted forward by the displacement period so the cloud is visible ahead of current price. The numbers themselves are still calculated from historical highs, lows, Tenkan and Kijun values. “Leading” therefore refers to plot position, not predictive knowledge of future prices.
Chikou Span applies the opposite visual convention: the current close is plotted backward by the displacement period. This lets the trader compare today’s closing price with older market context, but it does not give Chikou independent predictive power.
Tenkan-sen and Kijun-sen crossovers
A bullish Tenkan/Kijun cross occurs when Tenkan-sen moves above Kijun-sen; a bearish cross occurs when Tenkan-sen moves below Kijun-sen. The same cross can carry different context depending on where it occurs relative to the cloud and what price structure is doing.
| Cross | Location vs cloud | Typical context | What would weaken it |
|---|---|---|---|
| Bullish TK cross | Above Kumo | Aligned with existing bullish context | Price falls back into/below cloud or structure breaks down |
| Bullish TK cross | Inside Kumo | Mixed / transitional | No follow-through; repeated recrosses |
| Bullish TK cross | Below Kumo | Countertrend observation | Broader bearish structure remains intact |
| Bearish TK cross | Below Kumo | Aligned with existing bearish context | Price reclaims cloud or bearish structure fails |
| Bearish TK cross | Inside Kumo | Mixed / transitional | No follow-through; repeated recrosses |
| Bearish TK cross | Above Kumo | Countertrend observation | Broader bullish structure remains intact |
A TK cross is an indicator event, not a complete trade decision. In ranges, Tenkan and Kijun can cross repeatedly without a sustained trend.
Price vs cloud signals
A completed close above the cloud can be treated as evidence that price has moved into bullish cloud context; a completed close below it can support bearish context. Price inside the Kumo is less directional. For consistency, this article uses candle-close confirmation rather than a momentary intrabar penetration when discussing cloud breaks.
That convention is methodological rather than universal. A close-based rule reacts later than a wick-through rule and can still fail. Higher-timeframe swing structure, nearby horizontal levels and the behaviour of Tenkan/Kijun remain relevant after the cloud break.
How Chikou Span is used as confirmation
Chikou Span is the current close plotted 26 periods backward under the conventional setting. Traders often compare it with past price or past cloud context. When Chikou is clear of the older price cluster in the same direction as the current setup, it can add alignment; when it is entangled with prior candles or cloud, the picture is more mixed.
Chikou should be treated as confirmation context only. Its backward plot does not create foresight, and visual overlap can make it difficult to interpret in ranging markets.
Standard Ichimoku settings: 9 / 26 / 52 / 26
| Parameter | Conventional baseline | Component affected | If shortened | If lengthened |
|---|---|---|---|---|
| Tenkan lookback | 9 | Tenkan-sen | More responsive; potentially noisier | Smoother; slower |
| Kijun lookback | 26 | Kijun-sen and displacement reference | Faster baseline response | Slower baseline response |
| Senkou B lookback | 52 | Senkou Span B | Cloud reacts more quickly | Cloud reacts more slowly |
| Displacement | 26 | Senkou A/B forward; Chikou backward | Less visual displacement | More visual displacement |
These settings are a conventional baseline, not universally optimal parameters. The actual clock time represented depends on the chart timeframe. Any alternative setting should be documented and tested using the exact platform implementation and bar-close rules being evaluated. TradingView’s Technical Ratings documentation also uses 9/26/52 as its Ichimoku platform reference, without implying predictive performance.
Ichimoku in trending vs ranging markets
| Regime | Cloud behaviour | TK behaviour | Main risk |
|---|---|---|---|
| Directional trend | Price may remain predominantly on one side of Kumo; spans can stay ordered | Crosses can remain aligned for longer | Late recognition of reversal; false breakout |
| Range / chop | Price repeatedly enters/exits cloud; boundaries may flatten | Frequent crosses and recrosses | Whipsaw, overtrading and conflicting signals |
A flat Kijun or flat cloud boundary can become a visible reference zone, but it is not a guaranteed “magnet” or reversal level. Market structure or range boundaries should be used to classify the regime before interpreting a crossover or cloud break as continuation evidence.
A practical Ichimoku analysis framework
- Choose the timeframe and record the exact Ichimoku settings.
- Classify price as above, inside or below the Kumo and note whether the cloud is rising, falling or twisting.
- Check the Tenkan/Kijun relationship and slope, but do not treat a crossover as sufficient by itself.
- Use Chikou only as additional alignment or mixed-context evidence.
- Define a price-based confirmation and invalidation level before any trading hypothesis.
- Account separately for spread, slippage, gaps and position sizing, then test the full rule set rather than assuming the historical convention has an edge.
Worked forex example: multi-component alignment
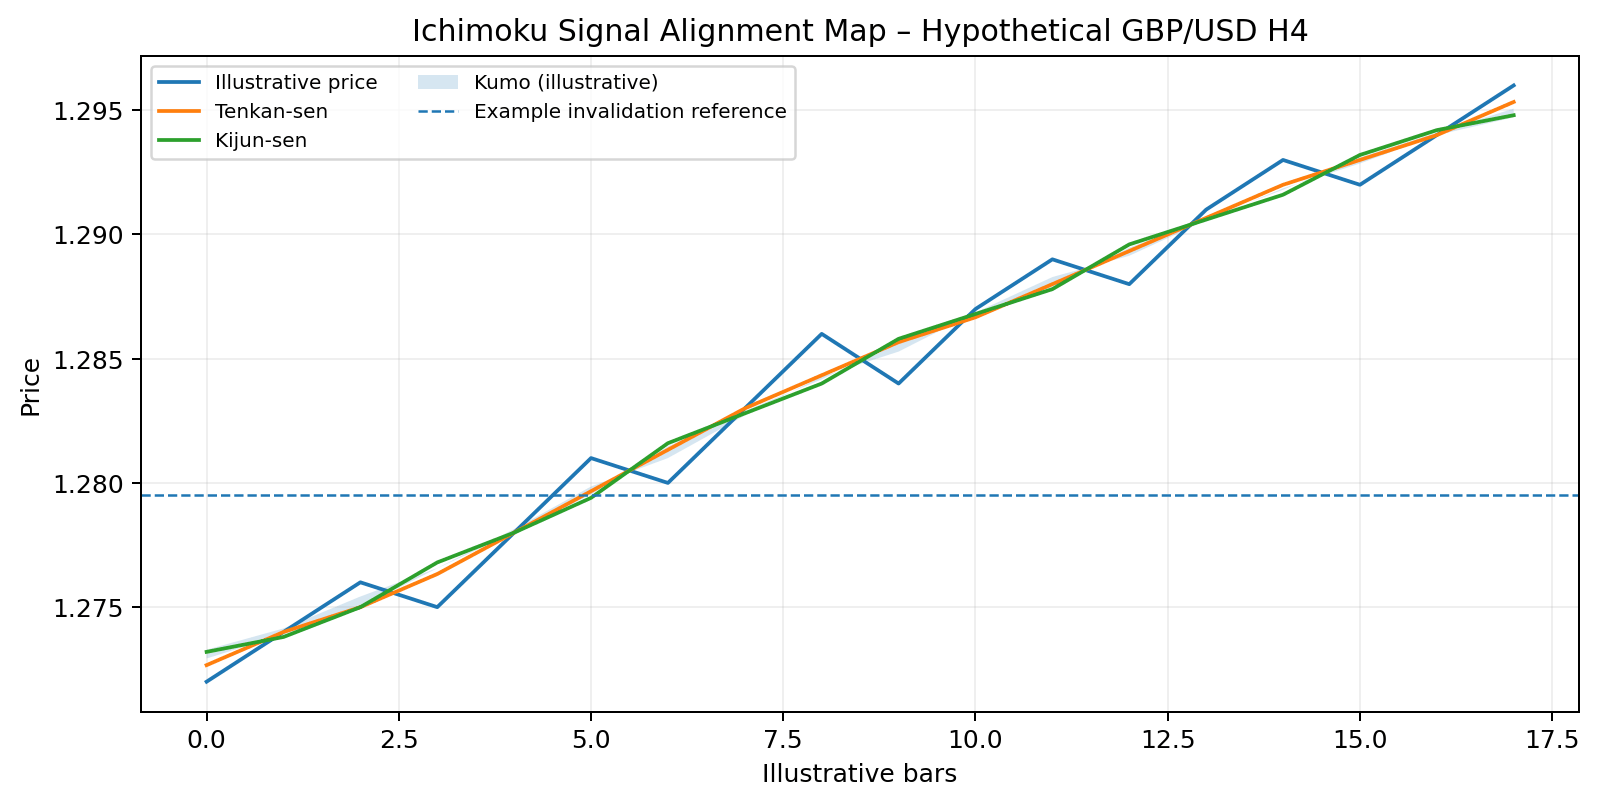
Consider a hypothetical GBP/USD 4-hour chart. The close is 1.2840, Tenkan-sen is 1.2828, Kijun-sen is 1.2809, and the current cloud zone at the same chart location is approximately 1.2785 to 1.2800. Price is above Kumo, Tenkan is above Kijun and Chikou is clear of the earlier price cluster in the illustrative chart.
Price-based invalidation reference: a close back below 1.2795, chosen from chart structure rather than from an Ichimoku line alone.
The components show multi-factor alignment with a bullish trend interpretation, but that is context rather than proof that price must continue higher. A cautious reading would still require the price structure to remain intact. A fast reversal, spread expansion, gap or failed cloud break can invalidate the interpretation.
Mixed / failed case: if price falls back into the Kumo while Tenkan crosses below Kijun and Chikou becomes congested with older price, the earlier alignment has weakened. That does not automatically confirm a bearish trend; it shows that the original bullish case needs reassessment.
Turn Trading Calculations Into Real Trading Decisions
Use your calculated risk levels, position sizing, and technical analysis together with live forex trading signals and market commentary from The Forex Complex.

Frequently asked questions
What is Ichimoku Kinko Hyo?
Ichimoku Kinko Hyo is a five-component trend and equilibrium framework. Tenkan-sen, Kijun-sen, Senkou Span A, Senkou Span B and Chikou Span are read together, with the two Senkou spans forming the Kumo cloud.
What are the standard Ichimoku settings?
A conventional baseline is 9 periods for Tenkan, 26 for Kijun, 52 for Senkou Span B and 26 periods of displacement. These are standard reference settings, not a universal optimum.
What does a Tenkan/Kijun crossover mean?
A bullish cross occurs when Tenkan rises above Kijun; a bearish cross is the reverse. Its context changes depending on whether the cross happens above, inside or below the cloud and whether price structure confirms it.
Is price above the Ichimoku cloud a buy signal?
No. Price above Kumo supports bullish trend context, but it is not an automatic entry. Cloud breaks can fail and need confirmation, invalidation and risk planning.
What does Chikou Span show?
Chikou Span is the current close plotted backward by the displacement period. Traders use it as contextual confirmation against older price and cloud structure, not as an independent predictive signal.
Does the Ichimoku cloud predict the future?
No. The cloud is drawn forward on the chart, but its values are calculated from historical price data. Forward displacement changes the visual reference point; it does not forecast future prices.




 Join Our Free Group

 Twitter