

In this article (14 sections)
- What is Elliott Wave theory?
- The five-wave motive structure
- The three core Elliott Wave rules for an impulse
- What is an ABC correction?
- Wave degree: why Elliott waves are nested
- Fibonacci ratios in Elliott Wave analysis
- The guideline of alternation
- How traders apply Elliott Wave theory to a chart
- Invalidation and alternate wave counts
- Why Elliott Wave counts can be subjective
- Worked forex example: a hypothetical GBP/USD five-wave count
- Common Elliott Wave mistakes
- Frequently asked questions
- Key takeaway
Elliott Wave Theory classifies market price action into recurring structures that unfold across different degrees of trend. Its best-known teaching model is a five-wave move in the direction of the larger trend followed by a corrective phase, often introduced as an A-B-C pattern. The framework includes hard structural rules, but features such as Fibonacci relationships and alternation are guidelines rather than guarantees. Multiple plausible wave counts can exist before price resolves the structure, so invalidation and alternate counts are central to disciplined use.
What is Elliott Wave theory?
Elliott Wave Theory, also called the Wave Principle, is a technical-analysis framework associated with Ralph Nelson Elliott. It classifies recurring price structures across multiple degrees of trend rather than treating every swing as an isolated event.
In the basic model, motive waves move in the direction of the trend one degree larger, while corrective waves move against that larger-degree trend. A motive sequence commonly contains five waves, while a correction is often introduced with three labelled segments, A-B-C. The important qualification is that this is a classification framework, not a deterministic forecasting engine: valid alternate interpretations can coexist while a structure is incomplete.
The five-wave motive structure
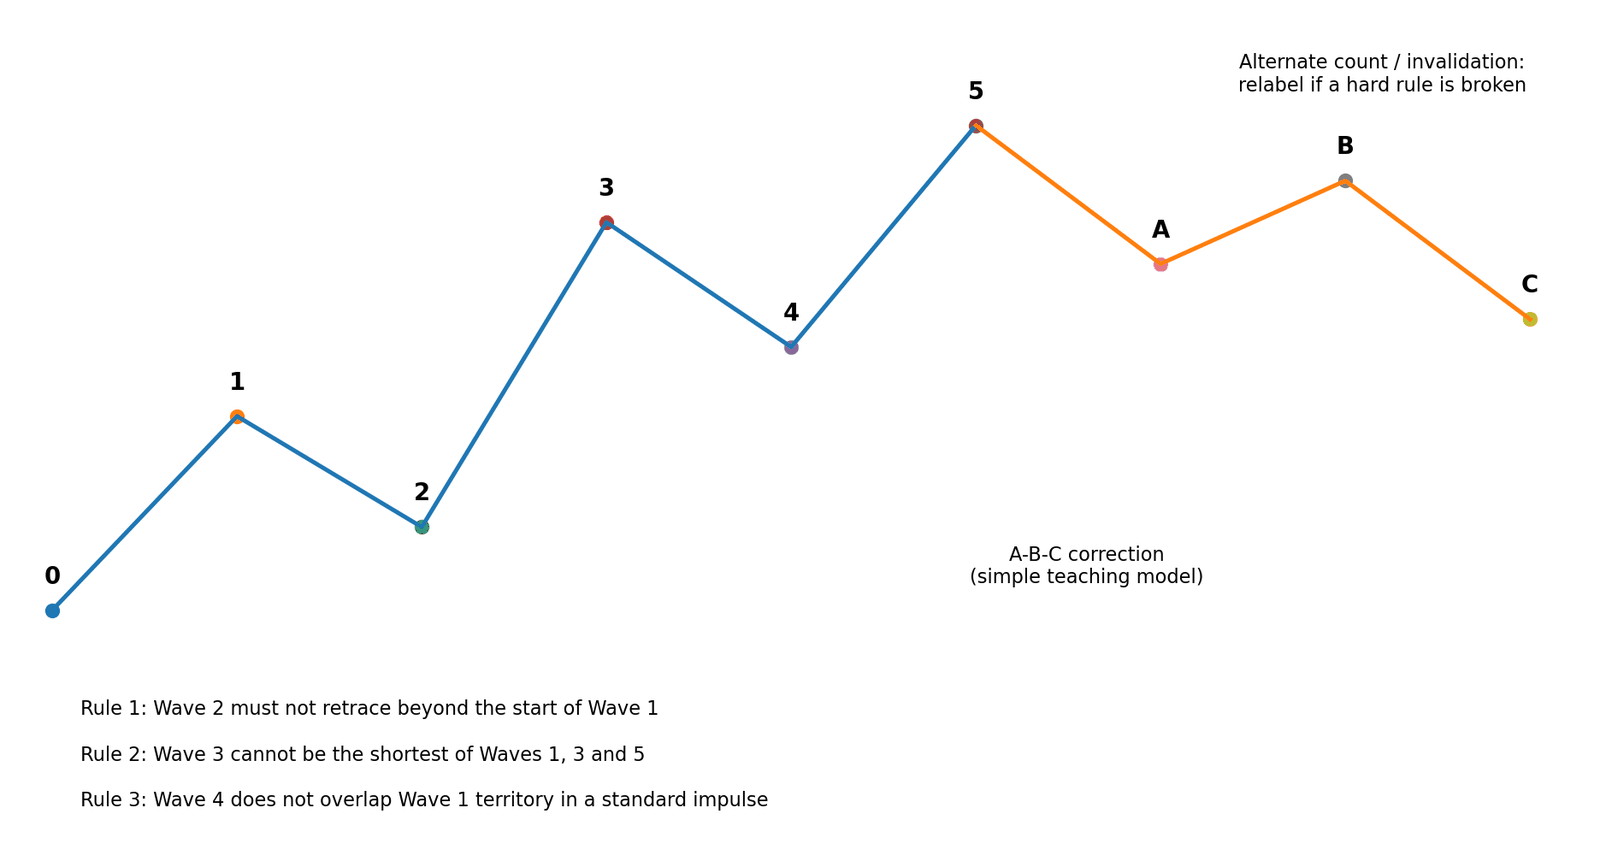
A standard impulse contains five waves. Waves 1, 3 and 5 move in the direction of the larger trend; waves 2 and 4 correct part of the preceding advance or decline. At an introductory level, the standard impulse subdivides 5-3-5-3-5.
An impulse is the most familiar motive-wave structure, but it is not the only one. Diagonals are also motive structures and have different internal characteristics, including the possibility of wave 4 overlapping wave 1 price territory. That distinction matters because rules that apply to a standard impulse should not be universalised to every motive structure.
| Wave | Direction vs larger trend | Typical role | Key rule / caveat |
|---|---|---|---|
| 1 | With | Starts the impulse | Must establish progress before wave 2 retraces it |
| 2 | Against | Corrects wave 1 | Cannot retrace beyond the start of wave 1 |
| 3 | With | Often the strongest actionary leg | Cannot be the shortest of waves 1, 3 and 5 |
| 4 | Against | Corrects wave 3 | Does not overlap wave 1 territory in a standard impulse; diagonals differ |
| 5 | With | Completes the five-wave sequence | May extend or truncate; completion does not guarantee reversal |
The three core Elliott Wave rules for an impulse
For a standard impulse, three hard structural rules determine whether the count can remain valid. These are not entry signals. They are classification constraints that help an analyst decide when a preferred count must be abandoned or relabelled.
| Rule | What it says | What invalidates the count |
|---|---|---|
| Wave 2 | Wave 2 cannot retrace more than 100% of wave 1. | Price moves beyond the origin of wave 1 under the proposed count. |
| Wave 3 | Wave 3 cannot be the shortest of waves 1, 3 and 5. | Once waves 1, 3 and 5 can be measured, wave 3 is shorter than both other actionary waves. |
| Wave 4 | Wave 4 does not overlap wave 1 price territory in a standard impulse. | Wave 4 enters wave 1 territory. Diagonals are a separate motive structure and can overlap. |
Rules vs guidelines
A rule defines whether a labelled structure is valid under the Elliott Wave framework. A guideline describes a common tendency that may improve a count but can fail without automatically invalidating it. Alternation, extensions and many Fibonacci relationships belong to the guideline category. This distinction prevents analysts from rejecting an otherwise valid count simply because a preferred tendency did not appear.
What is an ABC correction?
An A-B-C correction is a common introductory model for price movement against the larger-degree trend. Wave A begins the correction, wave B partially retraces or interrupts it, and wave C resumes the corrective direction. The labels describe structure; they do not guarantee what price will do after wave C.
Not every corrective phase is a simple three-leg zigzag. Elliott Wave corrections also include flats, triangles and combinations, and some corrections become more complex as they develop. For that reason, the A-B-C model is useful for teaching the concept without being a complete taxonomy of corrective structures.
| Structure | Basic shape | Direction vs larger trend | Key caveat |
|---|---|---|---|
| ABC / zigzag | Three-part correction with a directional look | Against | Useful teaching model; not every correction is a simple zigzag |
| Flat | Sideways or broad A-B-C family | Against / sideways | Wave B can retrace deeply; geometry differs from a zigzag |
| Triangle | Contracting or expanding multi-leg correction | Generally sideways | Usually requires more than three visible segments |
| Combination | Two or more corrective structures linked together | Against / sideways | Complexity can increase while the correction unfolds |
Wave degree: why Elliott waves are nested
Wave degree describes the scale of a wave relative to larger and smaller structures. A wave can subdivide into smaller-degree waves, while a complete five-wave sequence can itself form one component of a larger-degree move. This nesting is one reason a chart can look bullish on one timeframe while still sitting inside a larger corrective structure.
A practical count should therefore state the analysis timeframe and keep labels internally consistent. Mixing small intraday swings with larger daily swings as though they were the same degree can create contradictory counts and false rule violations.
Fibonacci ratios in Elliott Wave analysis
Fibonacci retracements and extensions are commonly used to estimate possible relationships between waves after the structural count has been defined. Frequently referenced ratios include 38.2%, 50%, 61.8%, 100% and 161.8%. These are analytical reference levels, not hard validity rules and not guaranteed turning points.
| Reference ratio | Common analytical use | What it does not prove |
|---|---|---|
| 38.2% | Possible shallow retracement or wave relationship | That a correction must end there |
| 50% | Common midpoint reference despite not being a Fibonacci ratio | That the wave count is valid |
| 61.8% | Frequently watched retracement/extension relationship | That price must reverse at the level |
| 100% | Equality between two measured wave lengths | That the next wave has a fixed destination |
| 161.8% | Common extension reference for a strong actionary wave | That wave 3 must reach or exceed it |
The guideline of alternation
The guideline of alternation suggests that similar corrective waves often differ in form, depth or duration. A common teaching example is that a sharp wave 2 may be followed by a more sideways wave 4, or vice versa. Alternation can help build a scenario, but its absence does not by itself invalidate a standard impulse count.
How traders apply Elliott Wave theory to a chart
- Define the larger trend and wave degree. Choose the timeframe and decide what scale of structure you are analysing before assigning labels.
- Identify a plausible completed or developing structure. Look for coherent swings rather than forcing 1-2-3-4-5 labels onto every sequence.
- Apply hard rules first. Check wave 2 retracement, wave 3 length and wave 4 overlap before using softer evidence.
- Use guidelines as supporting evidence. Alternation and Fibonacci relationships can strengthen or weaken a scenario, but do not override structural rules.
- Keep an alternate count when justified. If more than one valid interpretation fits the chart, document the strongest alternative rather than hiding ambiguity.
- Define invalidation before acting. State the exact price behaviour that would invalidate each count. If it occurs, relabel instead of moving the boundary after the fact.
Invalidation and alternate wave counts
A useful Elliott Wave count should explain not only why it might be valid, but what would prove it wrong. Hard-rule violations can invalidate a standard impulse immediately. A weaker guideline, such as poor alternation or an unexpected Fibonacci relationship, may reduce confidence without formally invalidating the count.
| Scenario | Evidence | Invalidation level / condition | What makes the alternate more plausible |
|---|---|---|---|
| Primary: five-wave impulse | Five waves fit the standard impulse rules | Wave 4 overlaps wave 1 territory or another hard rule is broken | Price develops a three-wave or overlapping structure inconsistent with the impulse |
| Alternate: corrective advance | Overlapping, corrective subdivisions fit better | Price resolves into a clean rule-compliant impulse | Failure to make motive progress and increasing corrective complexity |
Why Elliott Wave counts can be subjective
Incomplete structures can support multiple starting points, wave degrees and corrective labels. Corrective waves are particularly difficult to classify in real time because they are more varied than standard impulses. A chart often looks much cleaner after later price action resolves the ambiguity.
Subjectivity is not removed by pretending one count is certain. It is managed by applying hard rules consistently, recording alternate counts, using the same degree of analysis and defining invalidation conditions before the outcome is known.
Worked forex example: a hypothetical GBP/USD five-wave count
Consider a simplified GBP/USD advance labelled as a possible standard five-wave impulse. The prices are hypothetical and are used only to demonstrate rule-based classification.
| Wave / point | Illustrative price | Observation |
|---|---|---|
| Start | 1.2500 | Origin of wave 1 |
| Wave 1 | 1.2700 | 200-pip advance |
| Wave 2 | 1.2580 | 120-pip retracement; remains above the 1.2500 origin |
| Wave 3 | 1.2920 | Advances beyond wave 1 and is longer than wave 1 |
| Wave 4 | 1.2810 | Pullback remains above the wave 1 peak at 1.2700 |
| Wave 5 | 1.3000 | Completes the illustrative five-wave sequence |
Wave 2 retraces 120 pips of the 200-pip wave 1 move, or 60%, without breaking the 1.2500 origin. Wave 3 is larger than wave 1, so it is not the shortest actionary wave. Wave 4 stays above the wave 1 peak at 1.2700, preserving the standard impulse non-overlap rule. The count therefore satisfies the three core rules in this simplified example.
After wave 5, price might begin an A-B-C correction, continue in a larger extension, or reveal that one of the earlier labels belonged to a different degree. The important lesson is that rule compliance keeps a count possible; it does not guarantee the next market move.
Common Elliott Wave mistakes
- Calling any five visible swings an impulse without checking subdivision and rules.
- Saying wave 3 must be the longest. The actual rule is that wave 3 cannot be the shortest of waves 1, 3 and 5.
- Applying the standard wave 4 non-overlap rule to diagonals without qualification.
- Treating alternation or Fibonacci ratios as mandatory validity rules.
- Assuming every correction is a simple A-B-C zigzag.
- Mixing wave degrees within one count.
- Moving labels or invalidation points after price contradicts the original thesis.
- Using a preferred wave count as a standalone trade signal or certainty statement.
Turn Trading Calculations Into Real Trading Decisions
Use your calculated risk levels, position sizing, and technical analysis together with live forex trading signals and market commentary from The Forex Complex.

Frequently asked questions
What is Elliott Wave Theory?
Elliott Wave Theory is a technical-analysis framework that classifies price movement into recurring motive and corrective structures across multiple wave degrees. The common teaching model is a five-wave move followed by a corrective phase, but the framework does not guarantee one future market outcome.
What are the three main Elliott Wave rules?
For a standard impulse: wave 2 cannot retrace beyond the start of wave 1, wave 3 cannot be the shortest of waves 1, 3 and 5, and wave 4 does not overlap wave 1 price territory. Diagonals require separate treatment.
What is an ABC correction in Elliott Wave?
An A-B-C correction is a three-part corrective structure labelled A, B and C that moves against the larger-degree trend. It is a useful introductory model, but corrections can also form flats, triangles and combinations.
Is wave 3 always the longest wave?
No. The hard rule is that wave 3 cannot be the shortest of waves 1, 3 and 5 in a standard impulse. Wave 3 is often extended, but it does not have to be the longest.
How are Fibonacci ratios used in Elliott Wave analysis?
Traders use Fibonacci retracements and extensions as reference measurements for possible wave relationships. They are guidelines, not structural validity rules, and they do not guarantee where a wave will end.
Why can Elliott Wave analysis be subjective?
Incomplete price structures may support multiple plausible starting points, wave degrees and corrective labels. A disciplined approach records alternate counts and defines the price behaviour that invalidates each scenario.
Key takeaway
Elliott Wave Theory is most useful as a structured scenario framework: classify motive and corrective waves, apply the hard impulse rules, use guidelines such as alternation and Fibonacci relationships as secondary evidence, and define invalidation for both primary and alternate counts. The framework can organise market structure, but it does not remove uncertainty or make one wave count certain before price confirms it.




 Join Our Free Group

 Twitter