

In this article (14 sections)
- What is an EMA in forex?
- How is the EMA calculated?
- EMA vs SMA: what is the practical difference?
- What do the 20 EMA, 50 EMA and 200 EMA represent?
- How traders read price relative to an EMA
- How a two-EMA crossover works
- Using the 200 EMA as a trend filter
- Is an EMA dynamic support or resistance?
- Why EMA strategies whipsaw in ranging markets
- A practical EMA trading framework
- Worked forex example: reading 20, 50 and 200 EMA context
- Common EMA mistakes
- Frequently asked questions
- Key takeaway
An exponential moving average (EMA) is a lagging price indicator that gives more weight to recent prices than a simple moving average. Forex traders commonly use EMAs to assess trend direction, compare short- and long-term price behaviour and frame pullbacks. Popular periods such as 20, 50 and 200 are conventions, not guaranteed settings, and EMA crossovers can whipsaw when the market moves sideways.
What is an EMA in forex?
EMA stands for exponential moving average. It is plotted directly on a price chart and applies exponentially declining weight to older observations, so newer prices influence the current value more strongly. Compared with an equal-length simple moving average (SMA), this normally makes the EMA respond faster when price changes.
The faster response is a trade-off, not evidence of better predictive accuracy. EMA remains a lagging indicator because it is calculated from data that have already occurred. In forex, traders often use it for trend context, crossovers, pullback analysis and dynamic support/resistance observations.
How is the EMA calculated?
EMA formula
Smoothing multiplier: α = 2 / (N + 1)
EMA(today) = Price(today) × α + EMA(previous) × (1 – α)
N is the lookback period and α is the smoothing multiplier. A shorter lookback creates a larger multiplier, so the newest price has more influence. A longer lookback creates a smaller multiplier and a smoother, slower-moving line.
- A seed value is needed to start the series. Many implementations use an SMA or an equivalent historical seed, so the earliest EMA values can differ slightly with platform history or implementation.
- Closing price is a common source, but platforms can allow alternative price inputs. The source used should be recorded when reproducing a chart or backtest.
- Older observations never simply receive equal weight as in an SMA; their influence decays through the previous EMA value.
EMA vs SMA: what is the practical difference?
| Feature | EMA | SMA | Practical implication |
|---|---|---|---|
| Weighting | More weight on recent prices | Equal weight inside the lookback | EMA reacts more strongly to new information |
| Responsiveness | Usually faster | Usually slower | Faster response can also increase sensitivity to noise |
| Lag | Present | Present | Both depend on historical prices |
| Best use | Trend/context tool | Trend/context tool | Neither is universally superior; match the tool to the method |
EMA is often chosen when a trader wants a moving average that reacts sooner to changing price. That can be useful during a clean trend, but in noisy or sideways conditions a more reactive line can also produce more frequent crosses and reversals.
What do the 20 EMA, 50 EMA and 200 EMA represent?
| Period | Relative responsiveness | Common analytical role | Main limitation |
|---|---|---|---|
| 20 EMA | Faster | Shorter-term trend or pullback reference | Can react strongly to short-term noise |
| 50 EMA | Medium | Medium-term trend/context reference | Still lags and can flatten in ranges |
| 200 EMA | Slow | Longer-term directional reference/filter | Can react well after price has already changed |
These numbers describe periods, not fixed time spans. A 20 EMA on a 5-minute chart summarises a very different amount of market time from a 20 EMA on a daily chart. The periods are widely used conventions, not a proof that one combination is optimal for every currency pair or timeframe.
How traders read price relative to an EMA
| Observation | Possible context | What it does not confirm |
|---|---|---|
| Price above a rising EMA | Bullish trend context may be present | That price must continue higher |
| Price below a falling EMA | Bearish trend context may be present | That price must continue lower |
| Price crossing a flat EMA repeatedly | Range or weak directional structure | A reliable reversal on every cross |
Slope matters. Price above a sharply rising EMA and price above a flat EMA are not equivalent observations. A single close across an EMA can occur during a pullback, range or false break, so price structure and the selected timeframe should remain part of the analysis.
How a two-EMA crossover works
A two-EMA crossover compares a faster EMA with a slower one. The fast EMA uses the shorter lookback. A bullish crossover occurs when the fast EMA moves above the slow EMA; a bearish crossover occurs when it moves below.
| Condition | What it shows | What it does not confirm | Context check |
|---|---|---|---|
| Fast EMA crosses above slow EMA | Recent prices have strengthened relative to the longer average | Guaranteed uptrend or profitable long entry | Are both EMAs rising and is price structure bullish? |
| Fast EMA crosses below slow EMA | Recent prices have weakened relative to the longer average | Guaranteed downtrend or profitable short entry | Are both EMAs falling and is price structure bearish? |
| Repeated crosses | Averages are changing order frequently | Useful trend signal by itself | Is the market ranging or highly choppy? |
Why crossovers lag
Both lines are calculated from past prices. By the time a 20 EMA crosses a 50 EMA, the underlying price relationship has already changed. A crossover confirms what has happened in the averages; it does not identify the exact beginning of a move.
Using the 200 EMA as a trend filter
A common framework uses the 200 EMA as a longer-term context filter. Price above a rising 200 EMA can support bullish context, while price below a falling 200 EMA can support bearish context. A flat 200 EMA or repeated price crossings weaken that simple interpretation.
The 200 EMA should not be described as institutional support, a guaranteed bull/bear boundary or a price level that must hold. It is simply a slow average whose usefulness depends on the timeframe, instrument and surrounding structure.
Is an EMA dynamic support or resistance?
Traders often use the phrase dynamic support or resistance when price repeatedly pulls back toward a moving average and then resumes the broader trend. The wording is descriptive: the EMA itself moves on every bar and is not a fixed horizontal price level.
- A pullback can stop near the EMA, overshoot it, close through it or gap across it.
- An EMA touch is not an execution guarantee and should not be treated as a precise order-fill price.
- Horizontal support/resistance, swing structure and the higher-timeframe trend can provide independent context around the moving average.
Why EMA strategies whipsaw in ranging markets
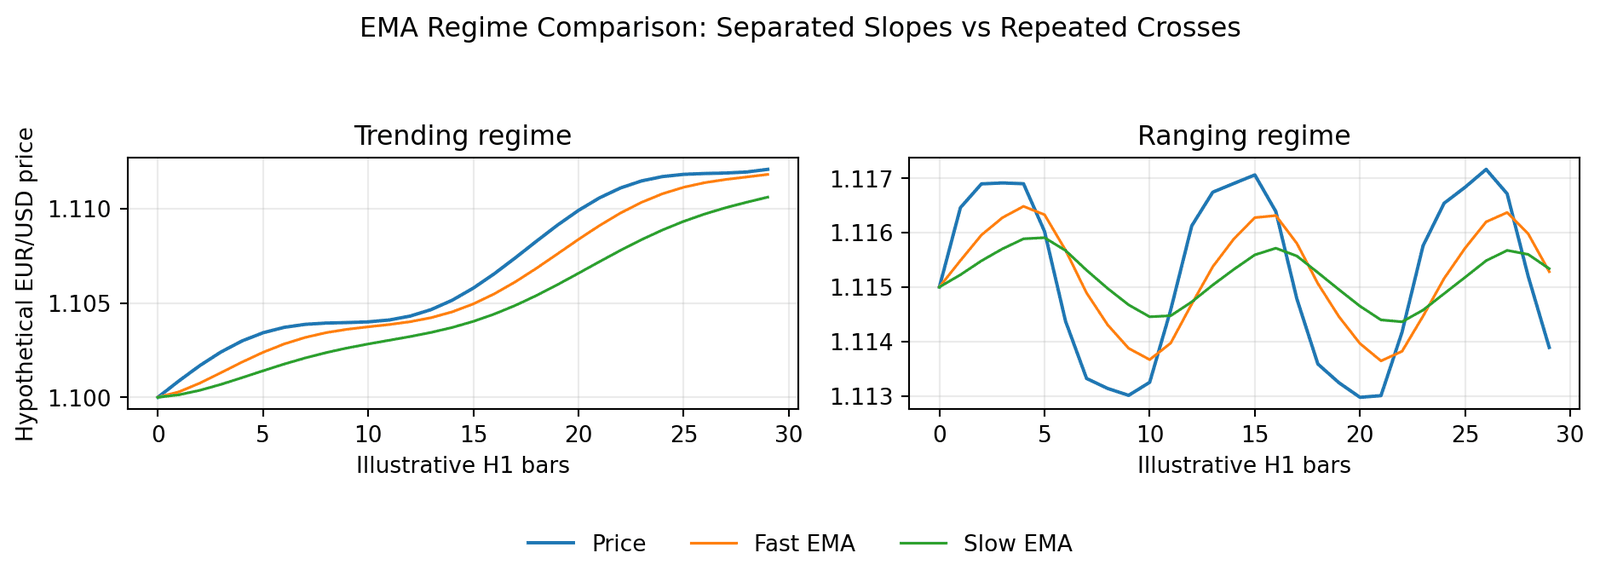
When price oscillates around a flat average, fast and slow EMAs can cross repeatedly without sustained follow-through. Shorter settings react sooner but can produce more false transitions; longer settings reduce sensitivity but can react later when a genuine trend develops.
| Market regime | EMA shape | Crossover behaviour | Main risk |
|---|---|---|---|
| Directional trend | Sloping and often separated | Fewer, more persistent changes in order | Late confirmation and eventual reversal lag |
| Range / chop | Flatter and intertwined | Frequent back-and-forth crosses | Whipsaw, costs and repeated false transitions |
A practical EMA trading framework
- Choose the analysis timeframe and record the EMA periods and source price.
- Classify price structure first: trend, range or transition.
- Check longer-term context, then the slope and ordering of the shorter EMAs.
- Treat a crossover or pullback as an observation that still needs price-based confirmation and a clear invalidation level.
- Include spread, slippage, gaps and position sizing in any paper test or backtest. Do not assume signal-price fills.
Not a standalone strategy
An EMA framework becomes testable only after the market regime, periods, source, confirmation rule, invalidation rule, execution assumptions and risk limits are defined. “Buy every bullish crossover” is not enough to establish an edge.
Worked forex example: reading 20, 50 and 200 EMA context
Consider a hypothetical EUR/USD 1-hour chart. The latest close is 1.1062. The 20 EMA is 1.1058, the 50 EMA is 1.1049 and the 200 EMA is 1.1015. The 20 and 50 EMAs are rising, the 200 EMA is gently rising, and price has recently formed a higher high and a higher low.
| Observation | Illustrative value / condition |
|---|---|
| Latest close | 1.1062 |
| 20 EMA | 1.1058 |
| 50 EMA | 1.1049 |
| 200 EMA | 1.1015 |
| EMA slopes | 20 and 50 rising; 200 gently rising |
| Price structure | Recent higher high and higher low |
Price is above all three averages and the 20 EMA is above the 50 EMA. If the 20 EMA had recently crossed above the 50 EMA, the crossover would describe a bullish change in the averages after price had already strengthened. The rising 200 EMA and HH/HL structure add trend context, but none of these observations guarantees continuation.
A cautious framework would define a separate price-based trigger and invalidation level. If price breaks the latest higher low while the EMAs still look bullish, the price-structure change should take priority over assuming that the moving averages will “hold”.
Example limitation
All values are hypothetical. EMA values depend on the price history, source and lookback. Crossovers lag, and real orders are affected by spread, slippage and market conditions.
Common EMA mistakes
- Treating 20, 50 or 200 as universally optimal periods.
- Assuming a crossover begins a trend rather than recognising that it occurs after price has already changed.
- Calling every EMA touch support or resistance.
- Using the same crossover logic inside a range without accounting for whipsaw.
- Adding more moving averages and assuming agreement automatically improves signal quality.
- Ignoring spread, slippage, gaps and fill assumptions in backtests.
- Optimising periods on one historical sample and treating the result as robust out of sample.
Turn Trading Calculations Into Real Trading Decisions
Use your calculated risk levels, position sizing, and technical analysis together with live forex trading signals and market commentary from The Forex Complex.

Frequently asked questions
What is EMA in forex?
EMA is an exponentially weighted moving average that gives more influence to recent prices. Forex traders use it for trend, momentum context and pullback analysis, but it remains a lagging indicator.
Which EMA is best for forex trading?
There is no universal best EMA. Shorter periods react faster and can be noisier; longer periods are smoother but slower. Period choice should match the instrument, timeframe and tested rules.
What is a 20 EMA and 50 EMA crossover?
It occurs when the 20-period EMA moves above or below the 50-period EMA. The crossover shows a change in the relationship between the two averages, but it appears after price has already moved and can whipsaw in a range.
What is the 200 EMA used for?
The 200 EMA is commonly used as a long-term trend reference or filter. It is not a guaranteed bull/bear boundary and its usefulness depends on the surrounding price structure and timeframe.
Does EMA act as support and resistance?
Price can repeatedly react around an EMA during a trend, which traders often describe as dynamic support or resistance. The moving average is not a fixed barrier and price can trade straight through it.
Why do EMA strategies fail in sideways markets?
In ranges, price can oscillate around flat averages and cause fast and slow EMAs to cross repeatedly without follow-through. That creates classic whipsaw behaviour and can increase trading costs if every cross is acted on.
Key takeaway
EMA is most useful as a structured way to summarise trend and relative price behaviour. The 20, 50 and 200 EMA can provide familiar reference points, but period choice, slope, market regime and price structure matter more than the number alone. Crossovers and “dynamic support” are contextual observations, not guarantees.




 Join Our Free Group

 Twitter