

In this article (11 sections)
- What are Bollinger bands?
- How Bollinger bands are calculated
- How to read the middle, upper and lower bands
- What does a Bollinger band squeeze mean?
- Bollinger bands in trending markets
- Mean reversion and Bollinger bands
- Bollinger band settings: what 20 and 2 actually mean
- How traders combine Bollinger bands with other evidence
- False signals and limitations
- Worked forex example: reading a squeeze and expansion
- Frequently asked questions
Bollinger Bands are a volatility-based indicator built around a moving average, with an upper and lower band positioned a set number of standard deviations away. As observed volatility rises, the bands usually widen; as it falls, they narrow. Traders use band width and price location for context, but an outer-band touch is not automatically a buy or sell signal.
What are Bollinger bands?
Bollinger Bands were developed by John Bollinger as adaptive trading bands. The standard construction has three lines: a middle simple moving average and two outer bands set above and below it by a multiple of standard deviation.
The bands provide a relative definition of high and low. A price near the upper band is relatively high within the chosen lookback and volatility framework; a price near the lower band is relatively low. That information can be useful, but price location still has to be interpreted alongside trend, volatility and market structure.
How Bollinger bands are calculated
The traditional default uses a 20-period simple moving average and outer bands two standard deviations away from that average. John Bollinger describes 20 periods and two standard deviations as defaults, not mandatory settings.
Bollinger’s traditional formulation uses the same data series for the average and the standard deviation and uses the population calculation for standard deviation.
Default Bollinger Bands formula
Middle Band = 20-period SMA
Upper Band = Middle Band + 2 x standard deviation
Lower Band = Middle Band – 2 x standard deviation
Standard deviation measures how dispersed recent prices are around their average. When that dispersion increases, the outer bands move farther from the middle band; when it decreases, they contract. This is a description of observed volatility, not a forecast of future volatility or price direction.
| Component | Traditional default | What it describes | Common misunderstanding |
|---|---|---|---|
| Middle band | 20-period SMA | Central tendency / intermediate trend reference | Not a guaranteed support or resistance line |
| Upper band | SMA + 2 standard deviations | Relatively high price area for the selected settings | A tag is not automatically a sell signal |
| Lower band | SMA – 2 standard deviations | Relatively low price area for the selected settings | A tag is not automatically a buy signal |
How to read the middle, upper and lower bands
The middle band is the reference average. The upper and lower bands show where price sits relative to recent dispersion around that average. A close outside a band can occur during strong directional movement, so the outer bands should not be treated as fixed overbought or oversold boundaries.
Outer-band touch is not a signal
John Bollinger’s official usage rules state that a tag of the upper band is not, by itself, a sell signal, and a tag of the lower band is not, by itself, a buy signal. In a strong trend, price can repeatedly “walk” an outer band.
What does a Bollinger band squeeze mean?
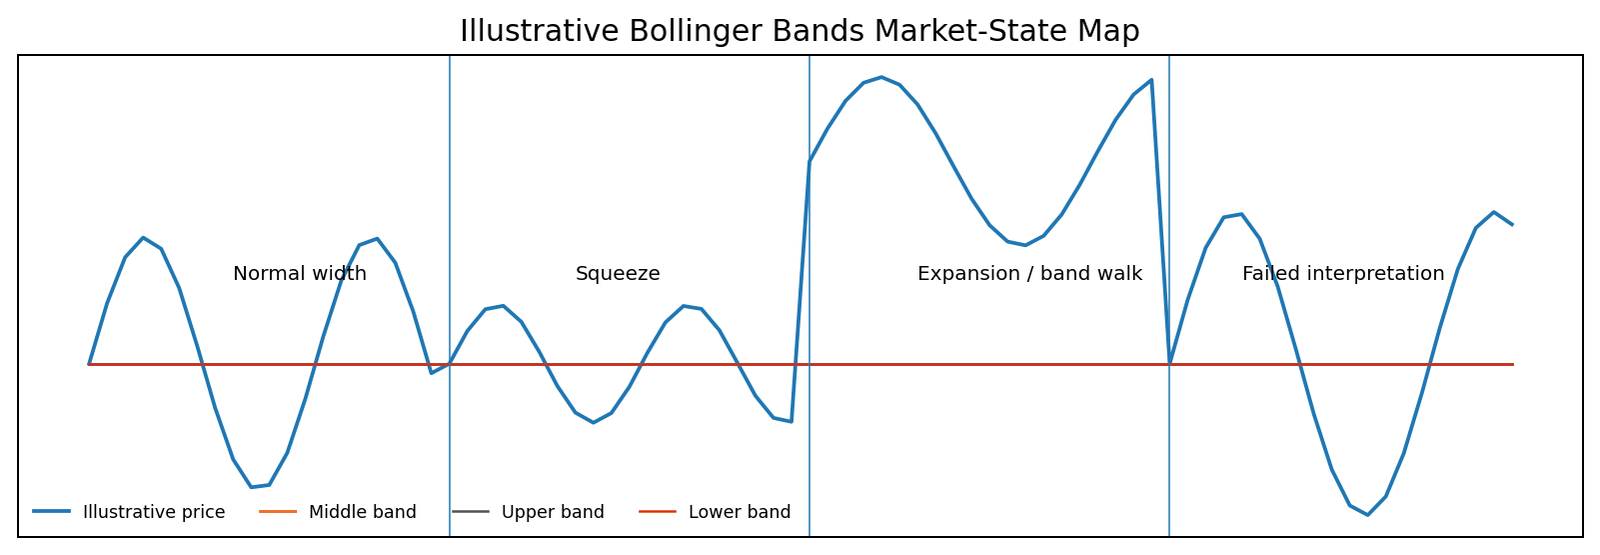
A Bollinger Band squeeze is a period in which the upper and lower bands contract materially relative to their recent width. It reflects lower observed volatility. A later expansion may accompany a larger price move, but the squeeze itself does not determine whether that move will be upward or downward.
BandWidth is a derived measure that can quantify how wide the bands are relative to the middle band. It is useful for identifying unusually narrow or wide conditions, but it does not remove false-breakout risk.
Squeeze vs expansion
Narrowing bands describe volatility contraction. Widening bands describe increasing dispersion. Neither condition is inherently bullish or bearish.
Bollinger bands in trending markets
In a strong uptrend, price can move near or along the upper band for multiple bars. In a strong downtrend, it can do the same along the lower band. This “band walk” is one reason fading every outer-band touch can produce repeated false reversal assumptions.
John Bollinger’s rules also note that closes outside the bands can initially behave as continuation events rather than reversal signals. Traders therefore need broader price structure or other non-redundant evidence before treating a band event as confirmation of a trade idea.
Mean reversion and Bollinger bands
Mean-reversion logic assumes that price may move back toward a central tendency after an extension. In a range, an outer-band approach can help describe how far price has moved relative to recent volatility, but a band touch alone does not confirm a reversal.
The same interpretation can fail badly in persistent trends, where price may remain near an outer band while the middle band follows the move. The market regime therefore matters as much as the indicator reading.
| Market state | Typical band behaviour | Possible interpretation | Main limitation |
|---|---|---|---|
| Squeeze | Bands contract | Lower recent volatility | Does not identify breakout direction |
| Expansion | Bands widen | Higher recent volatility | Expansion can accompany either direction |
| Strong trend | Price may walk one outer band | Directional persistence / trend strength context | Outer-band contact is not a reversal signal |
| Range | Price oscillates more often across the band structure | Mean-reversion context may be considered | Ranges can break and invalidate the premise |
Bollinger band settings: what 20 and 2 actually mean
The number 20 is the traditional lookback period for the middle-band simple moving average and the standard-deviation calculation. The number 2 is the traditional standard-deviation multiplier used to position the outer bands.
Shorter lookbacks react faster but can make the bands more sensitive to short-term fluctuations. Longer lookbacks respond more slowly and represent a broader window. Changing the multiplier changes the distance between the outer bands and the middle band.
Are 20 periods and 2 standard deviations mandatory?
No. They are traditional defaults. John Bollinger explicitly notes that the parameters needed for a particular market or task can differ. Any alternative should be tested for the intended instrument and timeframe using a consistent backtesting process rather than treated as universally superior.
| Parameter | Traditional default | What changing it affects | Caution |
|---|---|---|---|
| Lookback period | 20 | Responsiveness of the SMA and volatility window | Shorter is faster but noisier; longer is slower |
| Std.-dev. multiplier | 2.0 | Distance of outer bands from the middle band | Wider or narrower bands change frequency of touches |
| Price source | Platform-dependent, commonly close | Input series used for calculation | Keep the price source consistent when comparing settings |
How traders combine Bollinger bands with other evidence
Bollinger Bands can be combined with price structure such as support and resistance, swing highs and lows, and broader trend context. A momentum indicator may add a different type of information, while simply stacking multiple indicators derived from the same price behaviour can create the appearance of confirmation without much independent evidence.
In spot forex, volume also needs qualification because there is no single centralised exchange volume feed for the entire market. Broker or platform volume may be tick volume or venue-specific data rather than a consolidated total.
False signals and limitations
| Observation | Incorrect conclusion | Better interpretation |
|---|---|---|
| Price touches upper band | “Sell” | Price is relatively high for the chosen settings; trend may continue |
| Price touches lower band | “Buy” | Price is relatively low for the chosen settings; trend may continue |
| Bands squeeze | “Breakout will be up/down” | Volatility has contracted; direction still needs separate evidence |
| Two standard deviations | “About 95% of prices must stay inside” | Market-price distributions should not be assumed normal |
| Backtest works on one period | “Indicator is proven” | Results may reflect overfitting, costs or regime-specific behaviour |
Bollinger Bands are calculated from historical prices, so they react to observed price and volatility rather than forecasting future direction. John Bollinger specifically cautions against assuming that the use of standard deviation means market prices follow a normal distribution or that a textbook 95% containment rule should apply.
Worked forex example: reading a squeeze and expansion
Consider a hypothetical EUR/USD chart using the traditional 20-period, 2-standard-deviation settings. Suppose the 20-period SMA is 1.1000 and the current standard deviation is 0.0030.
Initial calculation
Upper Band = 1.1000 + (2 x 0.0030) = 1.1060
Lower Band = 1.1000 – (2 x 0.0030) = 1.0940
Later, assume the same illustrative middle band remains at 1.1000 while standard deviation contracts to 0.0015. The upper band becomes 1.1030 and the lower band becomes 1.0970. The narrower distance describes a squeeze relative to the earlier state.
If price later closes at 1.1045, it is above the contracted upper band. That observation can be consistent with volatility expansion, but it is not automatically a sell signal and does not prove that a durable uptrend has begun. One outcome could be continued band-walking; another could be a failed breakout that returns quickly inside the bands.
The example is illustrative only. Actual execution can differ from chart levels because of spreads, slippage and fast market conditions.
Turn Trading Calculations Into Real Trading Decisions
Use your calculated risk levels, position sizing, and technical analysis together with live forex trading signals and market commentary from The Forex Complex.

Frequently asked questions
Can a Bollinger Band squeeze tell you which direction price will break?
No. A squeeze shows that recent volatility has contracted relative to the selected settings. A later expansion can occur in either direction, and the first breakout can fail.
Is price above the upper Bollinger Band overbought?
Not automatically. The upper band defines a relatively high price area within the current volatility framework. In strong trends, price can remain near or outside the upper band for several bars.
Why do Bollinger Bands widen and narrow?
The upper and lower bands are offset from the middle band by a standard-deviation measure. Greater recent dispersion widens the bands; lower dispersion narrows them.
Are 20 periods and 2 standard deviations always the best settings?
No. They are the traditional defaults, not universal optimal settings. Different markets, timeframes and analytical purposes may justify different parameters, which should be tested rather than assumed.
What is Bollinger BandWidth?
BandWidth is a derived measure of the distance between the upper and lower Bollinger Bands relative to the middle band. It is commonly used to quantify contraction and expansion.
Can Bollinger Bands be used alone?
They can describe relative price location and recent volatility, but one indicator does not remove uncertainty. Trend, price structure, execution conditions and risk controls remain relevant.




 Join Our Free Group

 Twitter